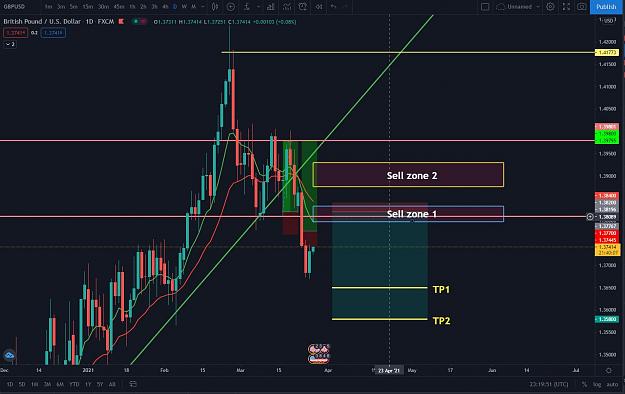
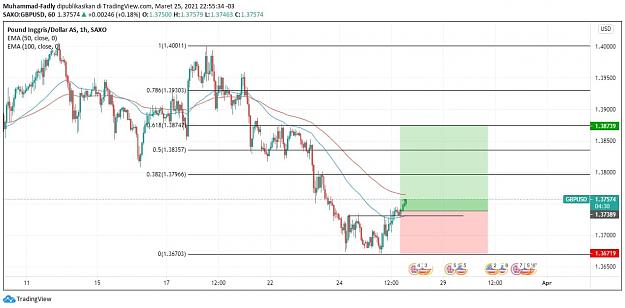
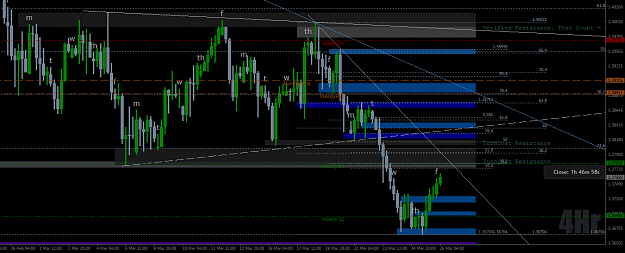
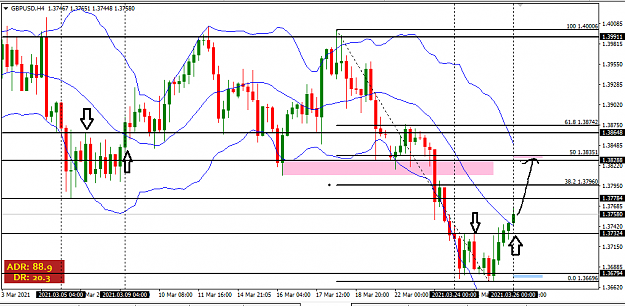
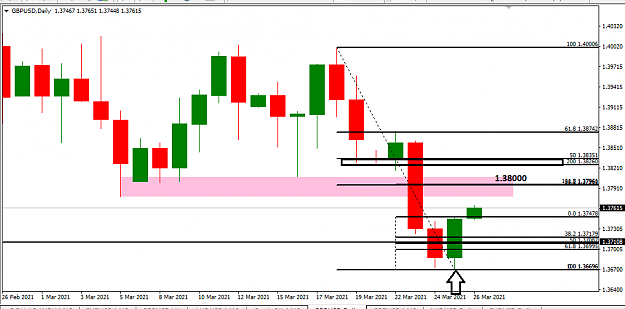
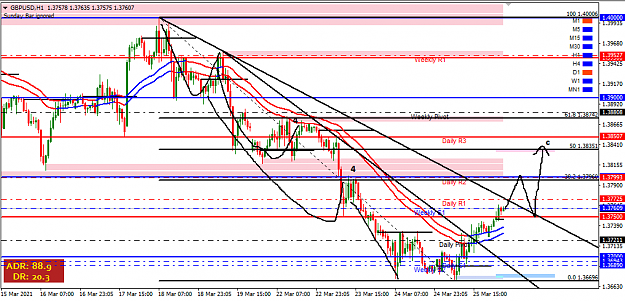
Disliked{quote} Im not sure what you mean by explain why because its more a visual if you can identify it on the price chart. There is a very key zone of support around 1.3674(@center) but the wicks past were not just tests but also completed an older daily FVG dating Feb. 5 21'. With it wicking out the zone(institutions clearing and winning $$$) and then closing on the support twice (bearish then bullish engulfing) before reversing and establishing new highs as well as the collection of volume on the 4hr that could be indicative of around a 200 pip move...Ignored
-Prophet
1