GBPUSD Weekly Technical Outlook
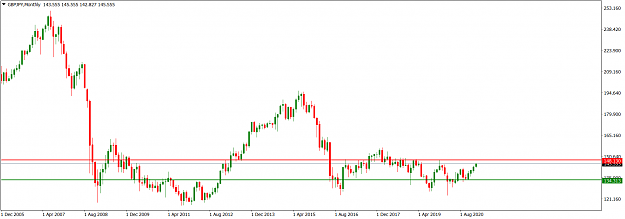
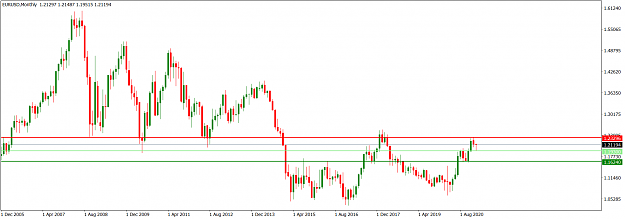
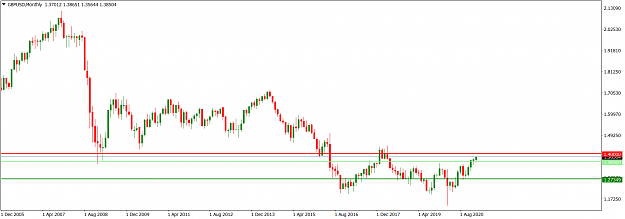
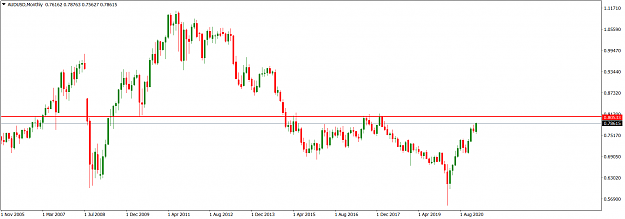
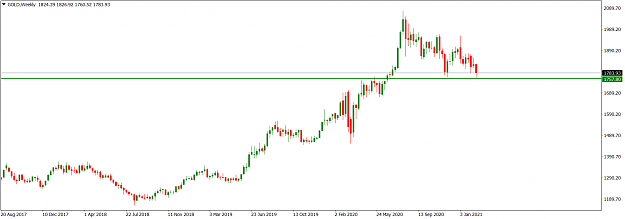
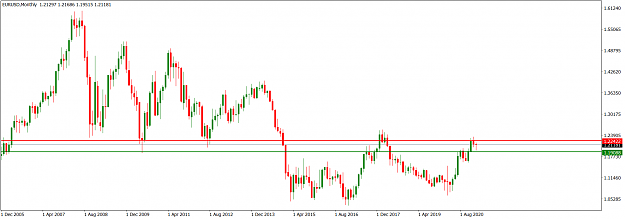
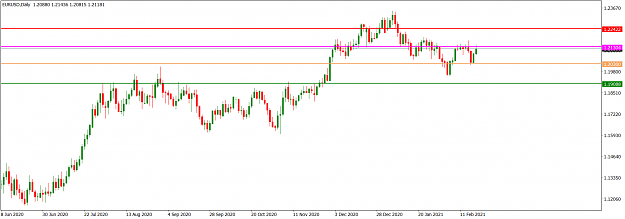
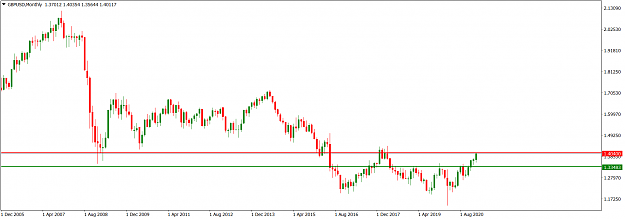
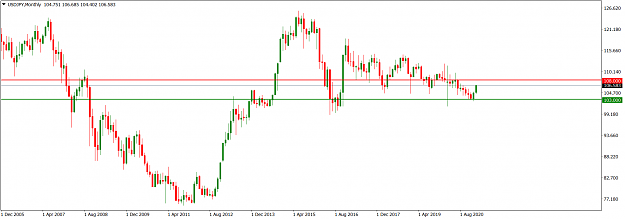
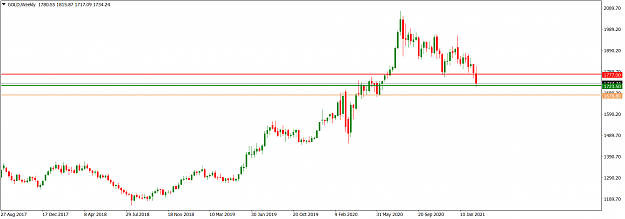
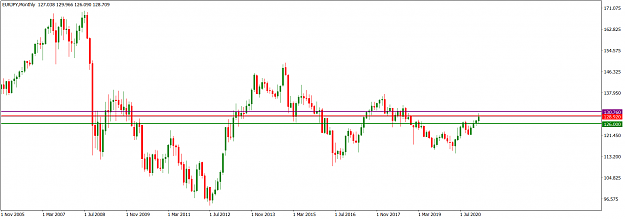
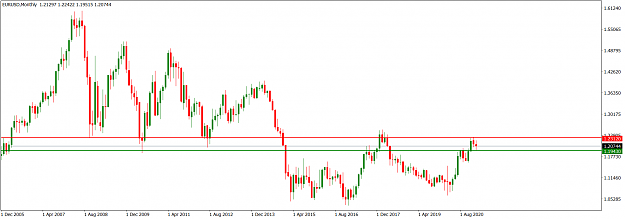
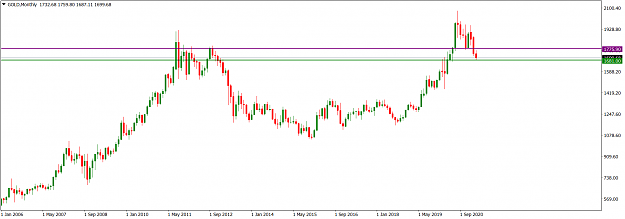
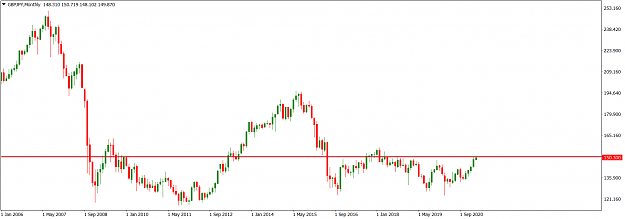
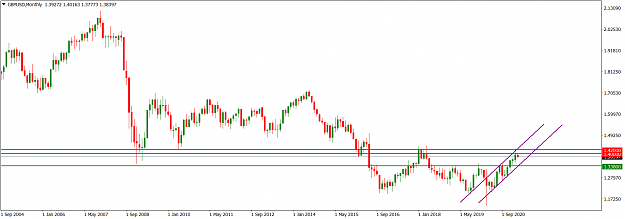
The GBPUSD market is still bullish but there is an increase in bearish pressure. On the monthly time frame, the January bullish print was relatively tiny, and the interim February print is at par with it. The operating horizontal resistance is at the 1.39800 area (purple) while the 1.33680 area (green) is the horizontal support on the monthly time frame.
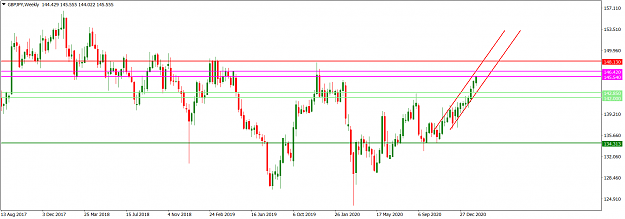
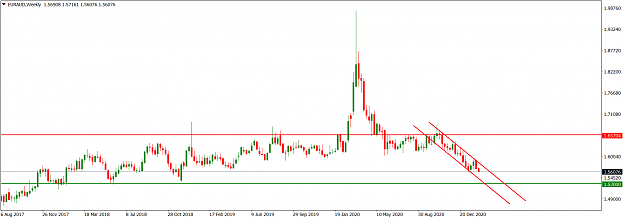
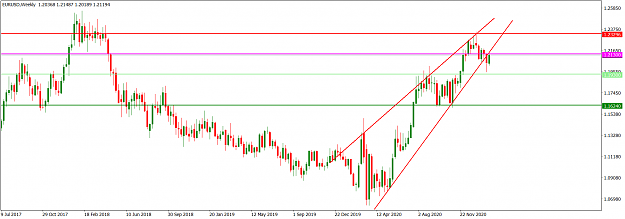
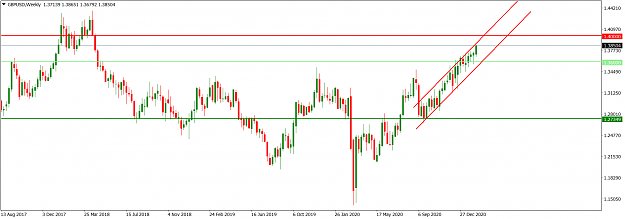
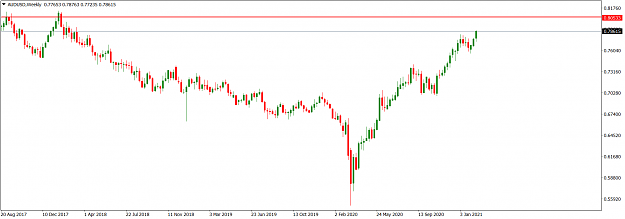
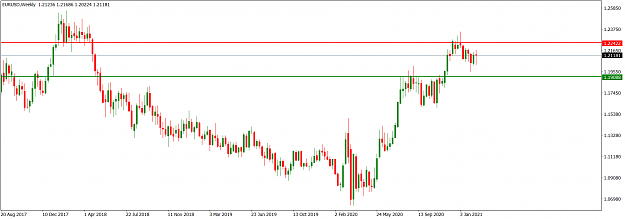
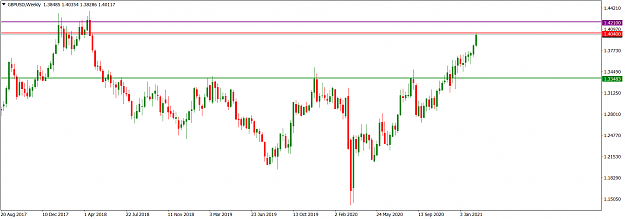
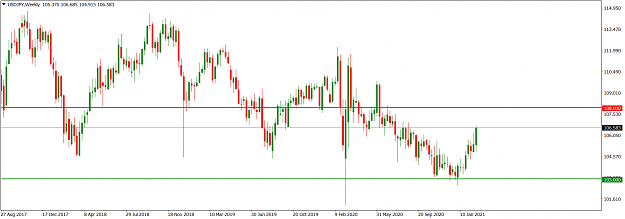
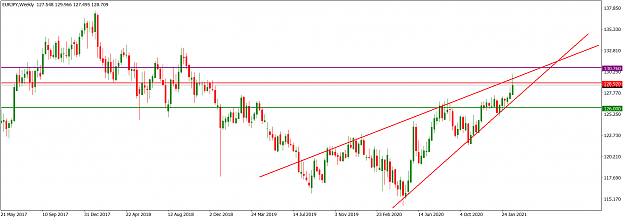
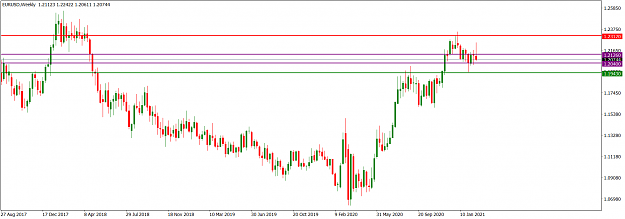
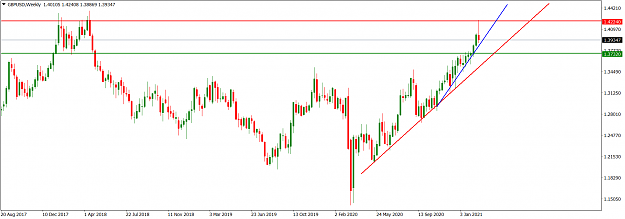
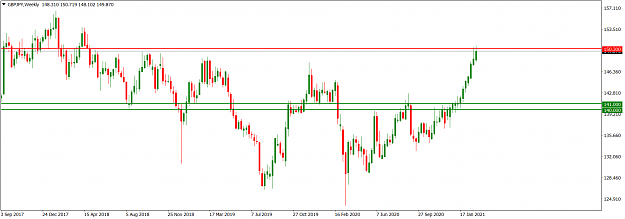
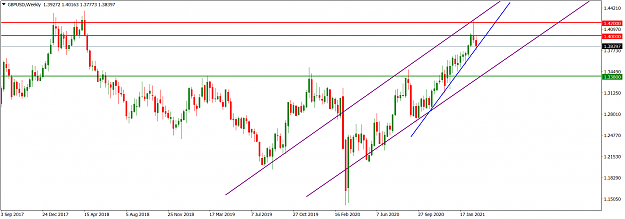
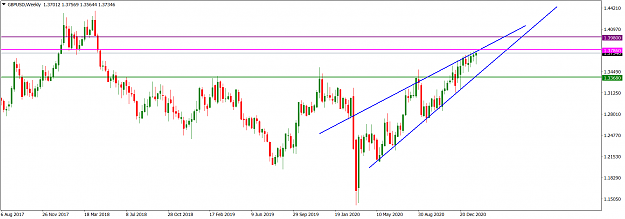
Market operation on the weekly time frame is grinding slowly northward in a rising wedge (blue). However, the candlestick prints are becoming less directionally pronounced. Market operation is presently at the wedge resistance trendline. This is proximal to the 1.37860 horizontal resistance area (magenta), and technically susceptible to a negative pressure.
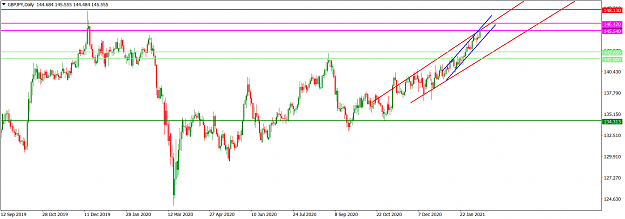
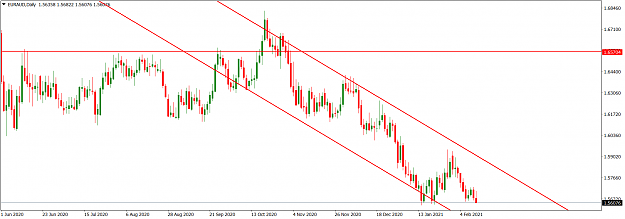
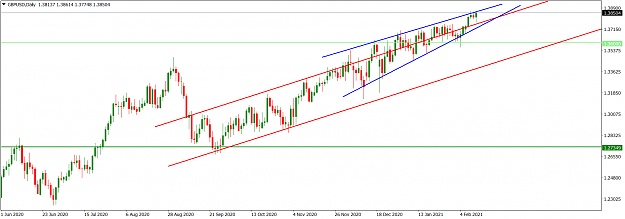
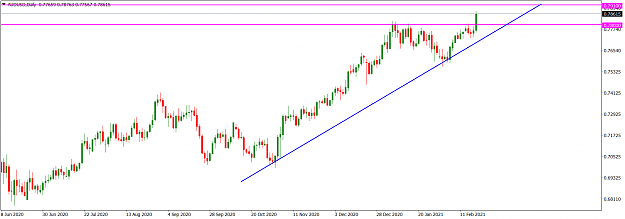
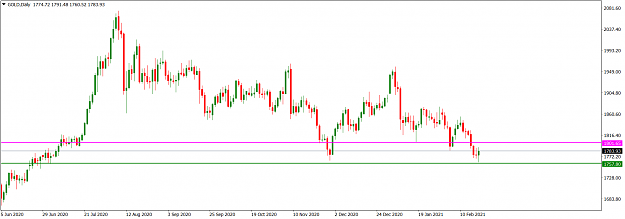
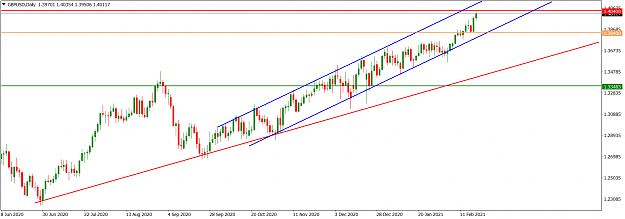
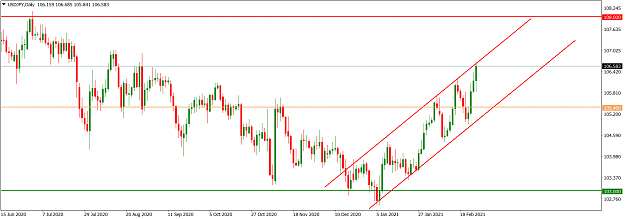
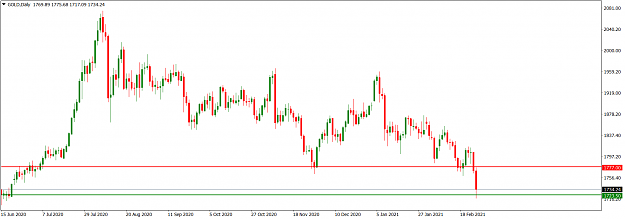
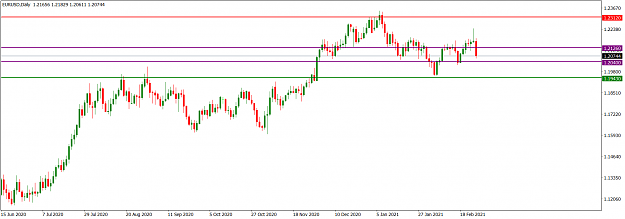
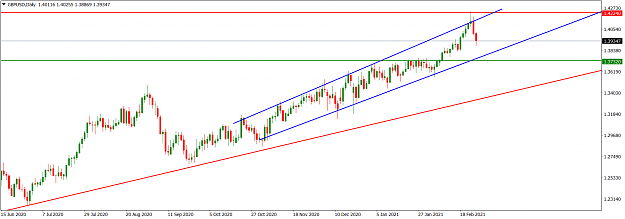
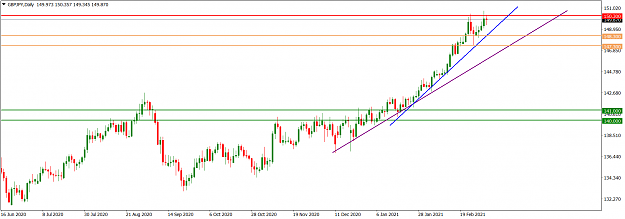
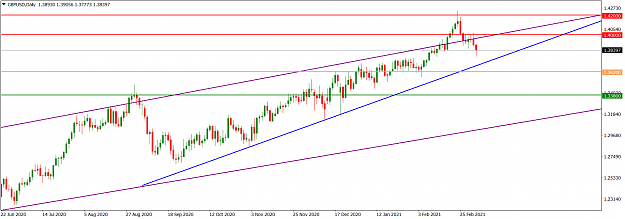
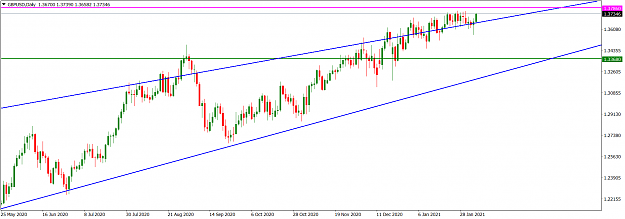
Price action on the daily time frame is presently choppy, consolidating around the horizontal resistance trendline of the rising wedge (blue) seen on the weekly time frame. It is also a few pips below the 1.37860 horizontal resistance area (magenta), and the sideways of price action is apparently a struggle to tackle this area. Failure of bulls to break above the area in the early part of this week may incentivize bears to attempt a southward turnaround.
I may be wrong. Trade safe and prosper.
KP
The GBPUSD market is still bullish but there is an increase in bearish pressure. On the monthly time frame, the January bullish print was relatively tiny, and the interim February print is at par with it. The operating horizontal resistance is at the 1.39800 area (purple) while the 1.33680 area (green) is the horizontal support on the monthly time frame.
Attached Image (click to enlarge)
Market operation on the weekly time frame is grinding slowly northward in a rising wedge (blue). However, the candlestick prints are becoming less directionally pronounced. Market operation is presently at the wedge resistance trendline. This is proximal to the 1.37860 horizontal resistance area (magenta), and technically susceptible to a negative pressure.
Attached Image (click to enlarge)
Price action on the daily time frame is presently choppy, consolidating around the horizontal resistance trendline of the rising wedge (blue) seen on the weekly time frame. It is also a few pips below the 1.37860 horizontal resistance area (magenta), and the sideways of price action is apparently a struggle to tackle this area. Failure of bulls to break above the area in the early part of this week may incentivize bears to attempt a southward turnaround.
Attached Image (click to enlarge)
I may be wrong. Trade safe and prosper.
KP
Do your homework, follow the footprints of smart money
1