• Home
  • Forums
  • Trades
  • News
  • Calendar
  • Market
  • Brokers
  • Login
  • Join
  • User/Email: Password:
  • 1:28pm
Menu
  • Forums
  • Trades
  • News
  • Calendar
  • Market
  • Brokers
  • Login
  • Join
  • 1:28pm
Sister Sites
  • Metals Mine
  • Energy EXCH
  • Crypto Craft

Options

Bookmark Thread

First Page First Unread Last Page Last Post

Printable Version

Similar Threads

Weekly/Monthly TOP Gainers Forexfactory Traders 4 replies

Major Pairs/Crosses - Trading Scenarios, Analyses & Forecasts 14 replies

Long Term Analyses - EURUSD, GOLD, and S&P 76 replies

USD/CAD - Loonie Toons, & mostly pointless analyses 2 replies

Lazy analyses thread 56 replies

  • Interactive Trading
  • /
  • Reply to Thread
  • Subscribe
  • 2,368
Attachments: Weekly Top-Down Technical Analyses
Exit Attachments

Weekly Top-Down Technical Analyses

  • Last Post
  •  
  • 1 5455565758 Page 59
  • 1 565758 Page 59
  •  
  • Post #1,161
  • Quote
  • Feb 7, 2021 4:43pm Feb 7, 2021 4:43pm
  •  KeenPips
  • Joined Dec 2015 | Status: Member | 6,357 Posts
GBPUSD Weekly Technical Outlook

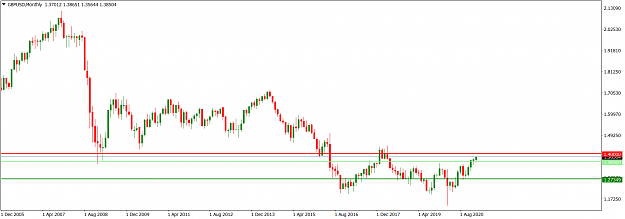
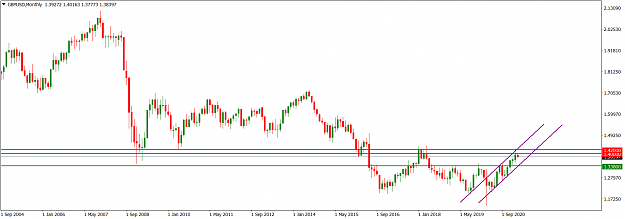
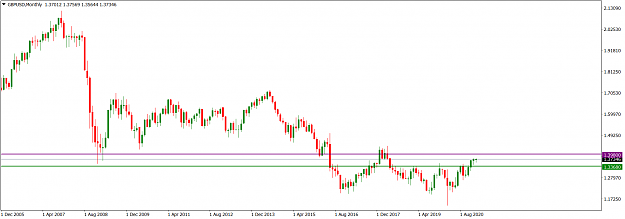
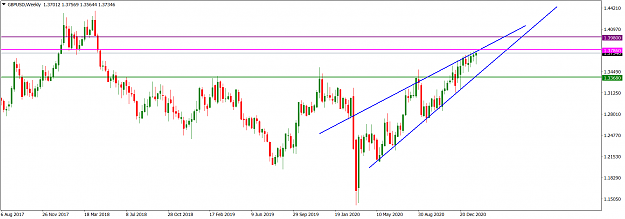
The GBPUSD market is still bullish but there is an increase in bearish pressure. On the monthly time frame, the January bullish print was relatively tiny, and the interim February print is at par with it. The operating horizontal resistance is at the 1.39800 area (purple) while the 1.33680 area (green) is the horizontal support on the monthly time frame.

Attached Image (click to enlarge)
Click to Enlarge

Name: GBPUSDMonthly_Feb 7, 2021.png
Size: 38 KB


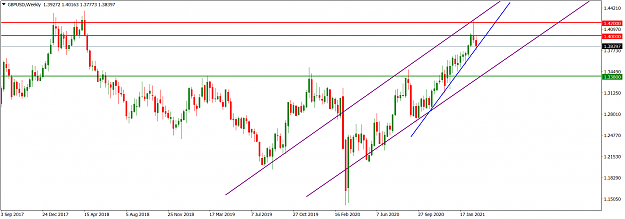
Market operation on the weekly time frame is grinding slowly northward in a rising wedge (blue). However, the candlestick prints are becoming less directionally pronounced. Market operation is presently at the wedge resistance trendline. This is proximal to the 1.37860 horizontal resistance area (magenta), and technically susceptible to a negative pressure.

Attached Image (click to enlarge)
Click to Enlarge

Name: GBPUSDWeekly_Feb 7, 2021.png
Size: 49 KB


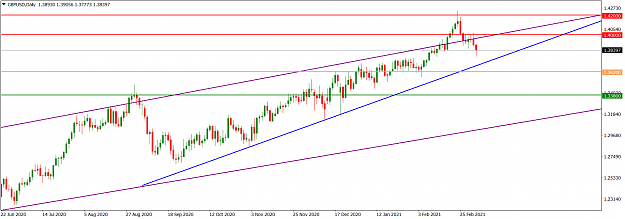
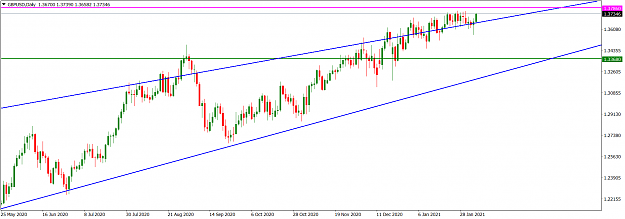
Price action on the daily time frame is presently choppy, consolidating around the horizontal resistance trendline of the rising wedge (blue) seen on the weekly time frame. It is also a few pips below the 1.37860 horizontal resistance area (magenta), and the sideways of price action is apparently a struggle to tackle this area. Failure of bulls to break above the area in the early part of this week may incentivize bears to attempt a southward turnaround.

Attached Image (click to enlarge)
Click to Enlarge

Name: GBPUSDDaily_Feb 7, 2021.png
Size: 47 KB


I may be wrong. Trade safe and prosper.

KP
Do your homework, follow the footprints of smart money
1
  • Post #1,162
  • Quote
  • Feb 13, 2021 2:55pm Feb 13, 2021 2:55pm
  •  KeenPips
  • Joined Dec 2015 | Status: Member | 6,357 Posts
GBPJPY market operation is still bullish. But any further bullish follow-through next week will have to break above 146.50 to be sustainable. Technical details on this pair and three others will be provided here before the market opens next week.

KP
Do your homework, follow the footprints of smart money
  • Post #1,163
  • Quote
  • Feb 14, 2021 4:03pm Feb 14, 2021 4:03pm
  •  KeenPips
  • Joined Dec 2015 | Status: Member | 6,357 Posts
GBPJPY Weekly Technical Outlook

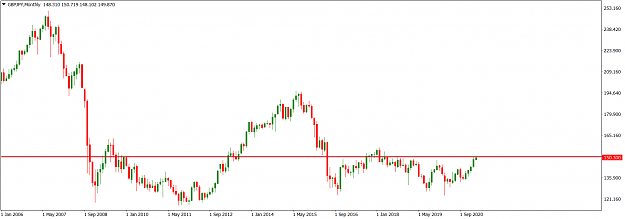
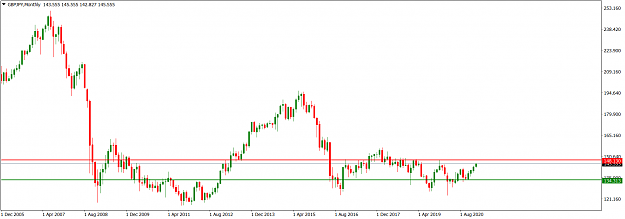
GBPJPY market operation is still bullish. On the monthly time frame, it is inching towards a minor horizontal resistance around 146.50. Further bullish move above the area is likely to be a retest of the 148.13 horizontal resistance area (red).

Attached Image (click to enlarge)
Click to Enlarge

Name: GBPJPYMonthly_February 14, 2021.png
Size: 39 KB


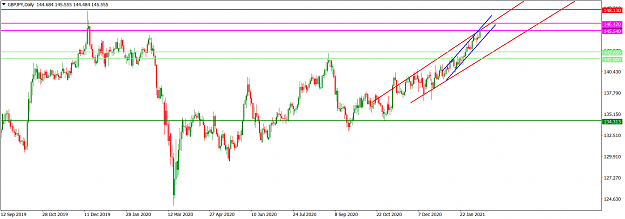
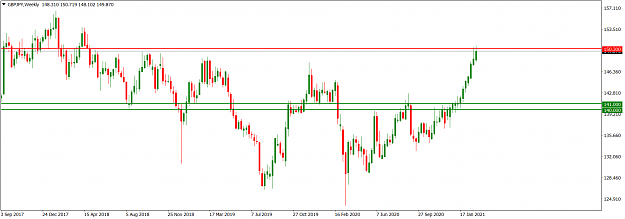
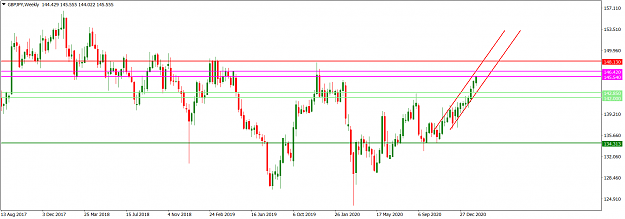
GBPJPY market operation on the weekly time frame continues to print bullish continuation candlesticks as it progresses within a rising channel (red). The order flow context is dominated by bulls. Presently, market operation is near the channel resistance trendline and has entered the immediate horizontal resistance around 145.450/146.420 (magenta). Any significant bullish breakout above the area may see bulls hunt the 148.13 horizontal resistance area (red). However, a southward rotation may see bears drive for the horizontal support around 142.85/142.00 (light green).

Attached Image (click to enlarge)
Click to Enlarge

Name: GBPJPYWeekly_February 14, 2021.png
Size: 50 KB


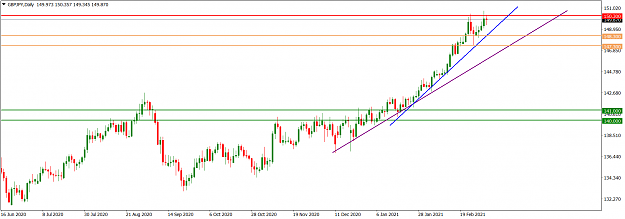
GBPJPY price action on the daily time frame is within a rising spiking channel (blue), which is at the upper half of the larger, rising channel (red) seen on the weekly time frame. This, technically, indicates an increased bullish momentum, but such a spiking channel often loses steam and is susceptible to a southward pullback. Besides, as the price action is entering the horizontal resistance around 145.450/146.420 (magenta), we should await how this area is handled in the early part of this week.

Attached Image (click to enlarge)
Click to Enlarge

Name: GBPJPYDaily_February 14, 2021.png
Size: 51 KB


I may be wrong. Trade safe and prosper.

KP
Do your homework, follow the footprints of smart money
  • Post #1,164
  • Quote
  • Feb 14, 2021 4:17pm Feb 14, 2021 4:17pm
  •  KeenPips
  • Joined Dec 2015 | Status: Member | 6,357 Posts
EURAUD Weekly Technical Outlook

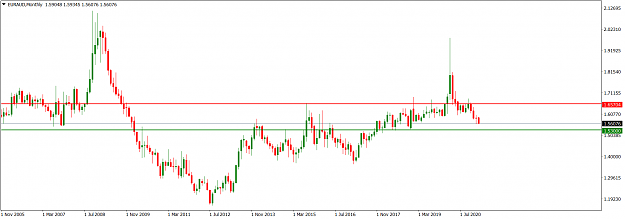
After the ambivalence of January 2021, EURAUD market operation has continued its bearish mode in February. On the monthly time frame, the interim candlestick print in February is bearish, but it is presently tackling a horizontal support area around 1.56000. A successful breakdown of the area may see bears target the multi-year horizontal support around 1.53000 (green).

Attached Image (click to enlarge)
Click to Enlarge

Name: EURAUDMonthly_February 14, 2021.png
Size: 41 KB


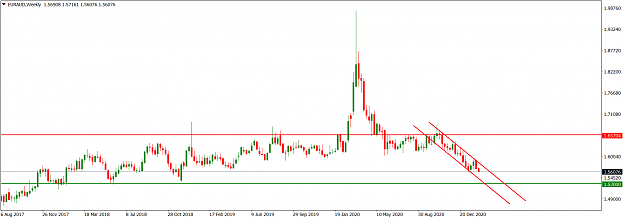
EURAUD market operation on the weekly time frame is in a falling channel (red). It is presently disposed southward within the channel after a bearish print at the channel resistance trendline two weeks ago. Last week, market operation printed a bearish candlestick which is relatively smaller. Presently, it is at a horizontal support around 1.56000.

Attached Image (click to enlarge)
Click to Enlarge

Name: EURAUDWeekly_February 14, 2021.png
Size: 36 KB


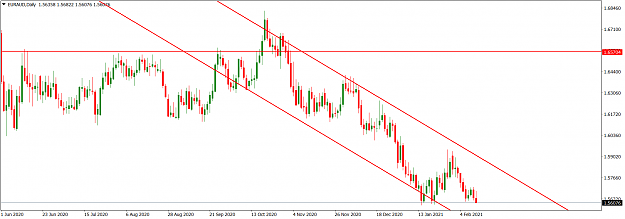
On the daily time frame, price action is presently in consolidation in a falling channel (red). It is located at the 1.56000 horizontal support area. As this area is susceptible to technical reaction, we should await what happens in the early part of this week.

Attached Image (click to enlarge)
Click to Enlarge

Name: EURAUDDaily_February 14, 2021.png
Size: 52 KB


I may be wrong. Trade safe and prosper.

KP
Do your homework, follow the footprints of smart money
  • Post #1,165
  • Quote
  • Feb 14, 2021 4:24pm Feb 14, 2021 4:24pm
  •  KeenPips
  • Joined Dec 2015 | Status: Member | 6,357 Posts
EURUSD Weekly Technical Outlook

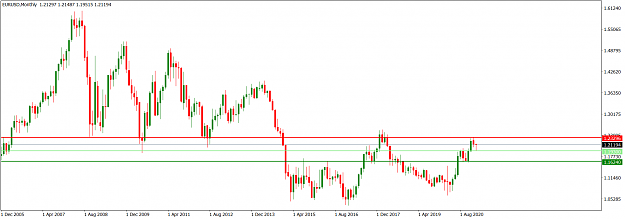
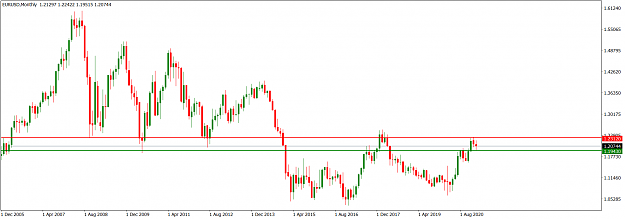
The bearish pressure on the EURUSD market which started in December 2020 has continued. On the monthly time frame, the January print was bearish. However, the interim bearish tone in February gave way to some ambivalent mode as market operation got to the horizontal support around 1.19300 (green). Initially, the February bearish print surged to the area but latterly a bullish fight-back pushed market operation back to retest a previously broken-down horizontal support around 1.21190, a bearish flip of which may lead to a retesting of the 1.19300 area (light green). The longer-term horizontal support, which may be of interest to investors, is around 1.16240 (green).

Attached Image (click to enlarge)
Click to Enlarge

Name: EURUSDMonthly_February 14, 2021.png
Size: 47 KB


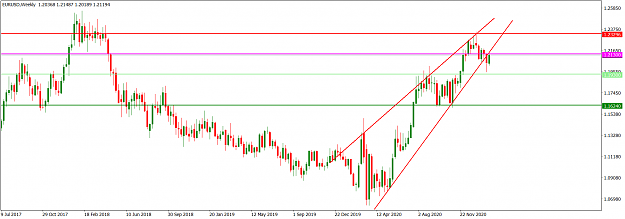
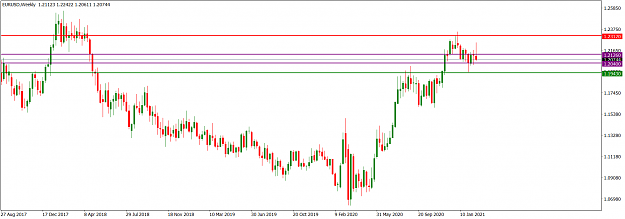
On the weekly time frame, two weeks ago, market operation printed a bearish candlestick that broke below a rising wedge (red). Last week, bulls effected a pullback, apparently to retest the breached wedge support trendline. Presently, market operation is at the intersection of the wedge support trendline and a horizontal resistance around 1.21300 (magenta). A bearish flip of the area this week may see further southward momentum.

Attached Image (click to enlarge)
Click to Enlarge

Name: EURUSDWeekly_February 14, 2021.png
Size: 51 KB


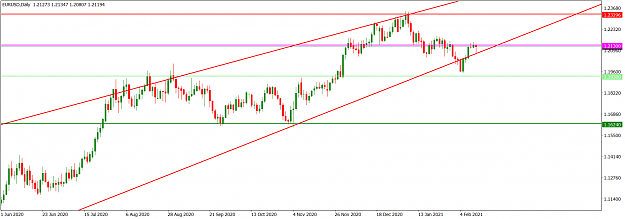
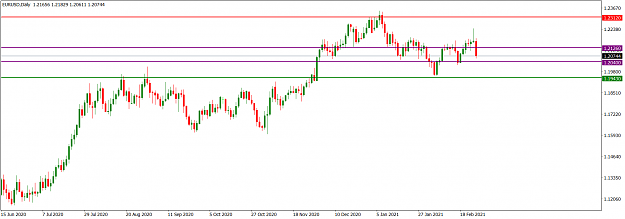
On the daily time frame, price action has surged back to within a rising wedge (red) after breaking below it several days ago. Presently, price action is sideways at the horizontal resistance area around 1.21300 (magenta). This indicates a directional pause, and what price action does in the early part of this week may signpost market mood for the week. A bearish flip of the area may see bears retest the horizontal support around 1.19300 (light green), but a bullish push-back may not produce much northward momentum as there are a few technical barriers to contend with.

Attached Image (click to enlarge)
Click to Enlarge

Name: EURUSDDaily_February 14, 2021.png
Size: 43 KB


I may be wrong. Trade safe and prosper.

KP
Do your homework, follow the footprints of smart money
1
  • Post #1,166
  • Quote
  • Feb 14, 2021 4:38pm Feb 14, 2021 4:38pm
  •  KeenPips
  • Joined Dec 2015 | Status: Member | 6,357 Posts
GBPUSD Weekly Technical Outlook

GBPUSD market operation is still technically toned northwards. However, the bullish momentum is declining. On the monthly time frame, market operation is contending with a horizontal resistance around 1.38250. A significant northward breach of the area may see bulls head for the multi-year horizontal resistance around 1.40000 (red). However, any bullish weakness may offer bears an opening for a southward retest of the 1.36000 horizontal support area (light green).

Attached Image (click to enlarge)
Click to Enlarge

Name: GBPUSDMonthly_February 14, 2021.png
Size: 38 KB


On the weekly time frame, market operation is within a rising channel (red) and recent candlestick prints largely favour bulls. Last week, market operation printed a bullish continuation candlestick which tested the channel resistance trendline before a brief retracement. This area is in confluence with a minor horizontal resistance around 1.38500. A bullish breakout of the channel may see buyers tackle the 1.4000 horizontal resistance area (red) seen on the monthly time frame. Alternatively, bears may take advantage of any bullish weakness to retest the 1.36000 horizontal support area (light green).

Attached Image (click to enlarge)
Click to Enlarge

Name: GBPUSDWeekly_February 14, 2021.png
Size: 48 KB


Price action on the daily time frame is consolidating in a symmetrical triangle (blue), crisscrossing the resistance trendline of the rising wedge (red) seen on the weekly time frame. Presently, it is at the triangle resistance area and the last three candlestick prints are mixed. The overall technical picture is that there is a decline in bullish momentum. This may incentivize bears to effect a southward pull.

Attached Image (click to enlarge)
Click to Enlarge

Name: GBPUSDDaily_February 14, 2021.png
Size: 47 KB


I may be wrong. Trade safe and prosper.

KP
Do your homework, follow the footprints of smart money
1
  • Post #1,167
  • Quote
  • Edited at 4:16pm Feb 20, 2021 4:03pm | Edited at 4:16pm
  •  KeenPips
  • Joined Dec 2015 | Status: Member | 6,357 Posts
The AUDUSD market is still toned positively but we may see some sideways, or even a pullback, in the early part of this week. Technical details on this pair and a few others will be given before the market opens.

KP
Do your homework, follow the footprints of smart money
  • Post #1,168
  • Quote
  • Feb 21, 2021 3:41pm Feb 21, 2021 3:41pm
  •  KeenPips
  • Joined Dec 2015 | Status: Member | 6,357 Posts
AUDUSD Weekly Technical Outlook

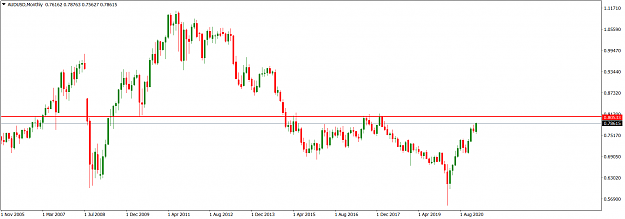
The AUDUSD market continues to be positively toned. On the monthly time frame, market operation has broken out of the January 2021 sideways mode as the interim February print heads northwards. It is presently at the 0.78600 area, an area which was last visited in March 2018. Any further significant bullish drive may see an attempt at the 0.80500 multi-year horizontal resistance area (red). A bearish rotation will likely target the 0.70600 horizontal support area initially.

Attached Image (click to enlarge)
Click to Enlarge

Name: AUDUSDMonthly_Feb 21, 2021.png
Size: 44 KB


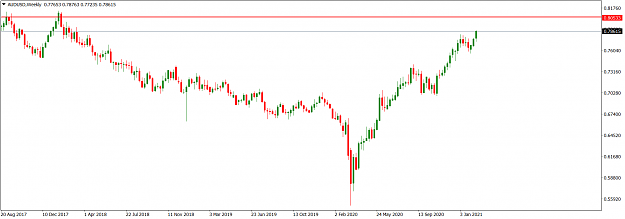
The last three weeks have seen bullish continuation prints on the AUDUSD weekly time frame. Although there are a few minor barriers ahead, any further strong bullish momentum may see the 0.80500 multi-year horizontal resistance area (red) targeted.

Attached Image (click to enlarge)
Click to Enlarge

Name: AUDUSDWeekly_Feb 21, 2021.png
Size: 37 KB


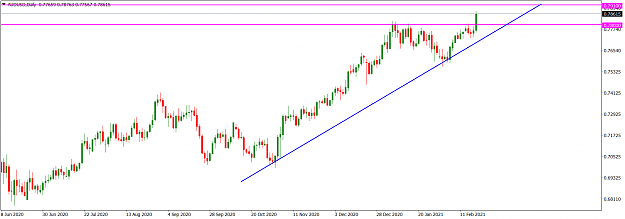
There has been an increase in bearish pressure on the AUDUSD daily time frame recently. However, the Friday print was a strong, relatively big bullish candlestick. This may be a last-ditch effort by bulls to assert their influence in the market or an attempt to trap traders for a bullish bias. Presently, price action has entered the 0.78000/0.79100 horizontal resistance zone (magenta) but a rising trendline (blue), traceable to November 2020, is still intact. We cannot rule out a sideways, or even a pullback, of price action from the zone. In the circumstance, it is better to await what happens in the early part of this week.

Attached Image (click to enlarge)
Click to Enlarge

Name: AUDUSDDaily_Feb 21, 2021.png
Size: 41 KB


I may be wrong. Trade safe and prosper.

KP
Do your homework, follow the footprints of smart money
  • Post #1,169
  • Quote
  • Feb 21, 2021 4:00pm Feb 21, 2021 4:00pm
  •  KeenPips
  • Joined Dec 2015 | Status: Member | 6,357 Posts
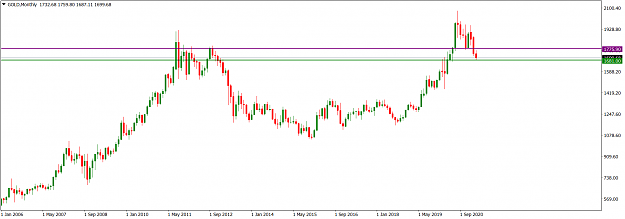
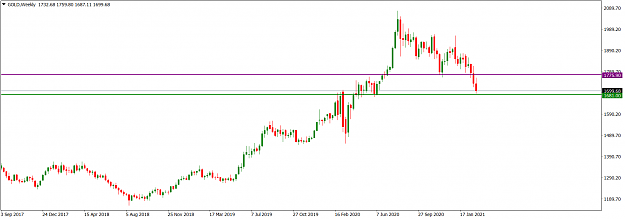
XAUUSD Weekly Technical Outlook

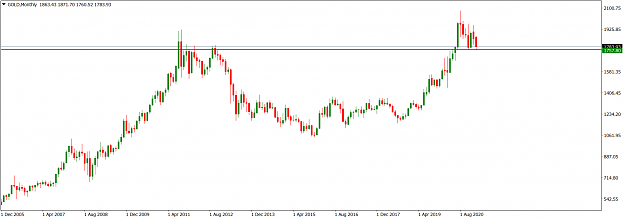
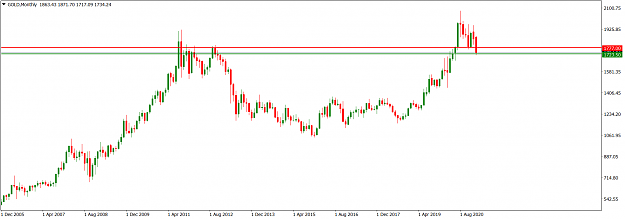
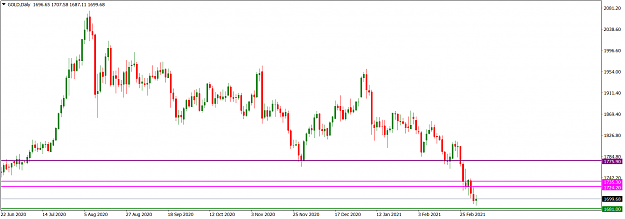
XAUUSD market operation has made a bearish move to enter a significant horizontal support zone around 1757.80 (green) after the bullish drive that took it to the 1895.00 horizontal resistance area in December 2020. On the monthly time frame, technically, the 1895.00/1757.80 zone is the prevailing horizontal channel for market operation.

Attached Image (click to enlarge)
Click to Enlarge

Name: GOLDMonthly_Feb 21, 2021.png
Size: 37 KB


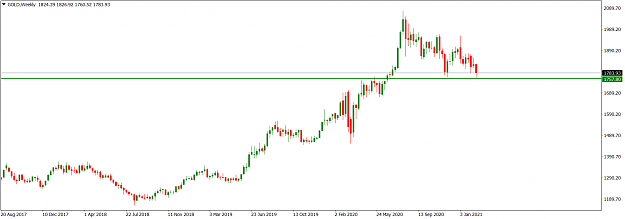
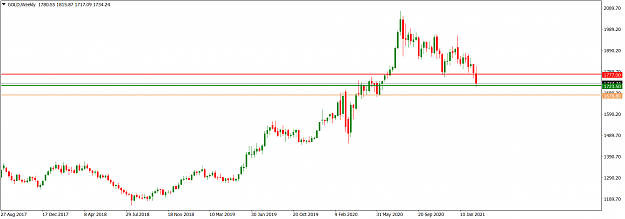
On the weekly time frame, XAUUSD market operation is in a bearish mode. It has entered the 1757.80 horizontal support area (green) seen on the monthly time frame. Last week, a bearish candlestick surged to the area but retraced northward, printing a lower tail. Although we may see another bearish attempt to retest the 1757.80 horizontal support in the early part of this week, a bullish pullback cannot be ruled out.

Attached Image (click to enlarge)
Click to Enlarge

Name: GOLDWeekly_Feb 21, 2021.png
Size: 34 KB


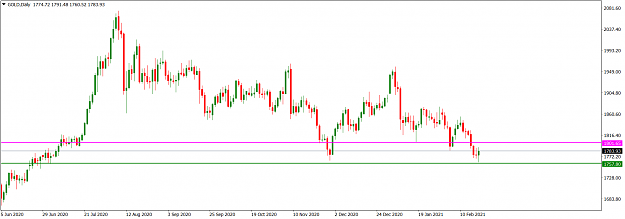
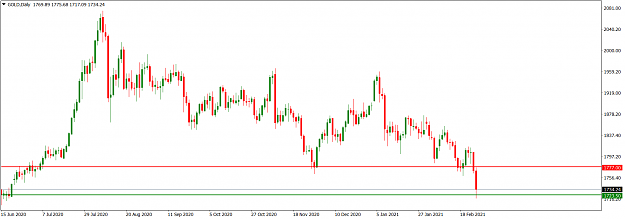
A morning star pattern has formed on the XAUUSD daily time frame. Technically, this portends a bullish outlook. This may see price action retrace to the 1801.65 broken-down horizontal support (magenta), from which a bearish turnaround may result in a role flip for a southward continuation.

Attached Image (click to enlarge)
Click to Enlarge

Name: GOLDDaily_Feb 21, 2021.png
Size: 43 KB


I may be wrong. Trade safe and prosper.

KP
Do your homework, follow the footprints of smart money
  • Post #1,170
  • Quote
  • Feb 21, 2021 4:27pm Feb 21, 2021 4:27pm
  •  KeenPips
  • Joined Dec 2015 | Status: Member | 6,357 Posts
EURUSD Weekly Technical Outlook

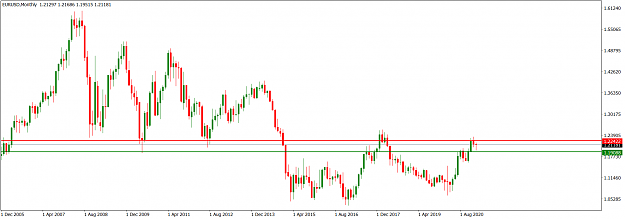
The EURUSD market is under an increased bearish pressure. On the monthly time frame, market operation entered the 1.22420 multi-year horizontal resistance (red) in December 2020 but gave way to a negative tone with the bearish print from the area in January 2021. In February, market operation has been ambivalent even though the interim print has a negative mood as it surged towards the 1.19088 horizontal support area (green) before snapping back northwards.

Attached Image (click to enlarge)
Click to Enlarge

Name: EURUSDMonthly_Feb 21, 2021.png
Size: 47 KB


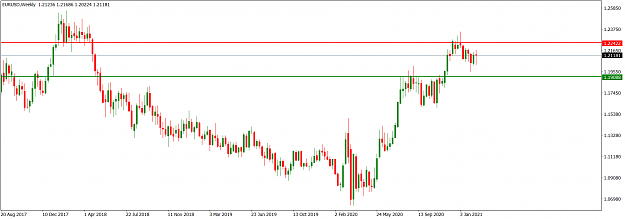
There is sideways market operation on the EURUSD weekly time frame. A bearish print three weeks ago has a long tail, indicating bullish resistance, which was followed up with a bullish print of almost equivalent size two weeks ago. Last week, the candlestick print was long-tailed doji-like but with a bearish tinge. This candlestick closed near the high of the bullish print of two weeks ago, indicating that bulls are still influential in the market.

Attached Image (click to enlarge)
Click to Enlarge

Name: EURUSDWeekly_Feb 21, 2021.png
Size: 46 KB


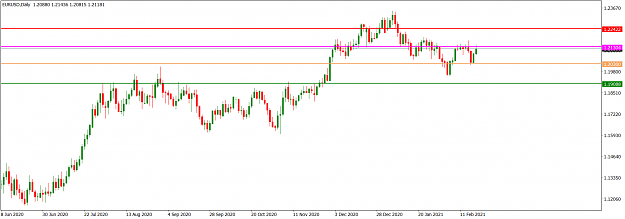
Price action on the daily time frame is disposed northwards. However, it is presently experiencing some bearish resistance as it tackles the 1.21300 horizontal resistance area (magenta) and there a few barriers to a bullish drive nearby. Any bearish rotation will likely target the horizontal support around 1.20300 (sandybrown) initially.

Attached Image (click to enlarge)
Click to Enlarge

Name: EURUSDDaily_Feb 21, 2021.png
Size: 38 KB


I may be wrong. Trade safe and prosper.

KP
Do your homework, follow the footprints of smart money
1
  • Post #1,171
  • Quote
  • Last Post: Feb 21, 2021 4:44pm Feb 21, 2021 4:44pm
  •  KeenPips
  • Joined Dec 2015 | Status: Member | 6,357 Posts
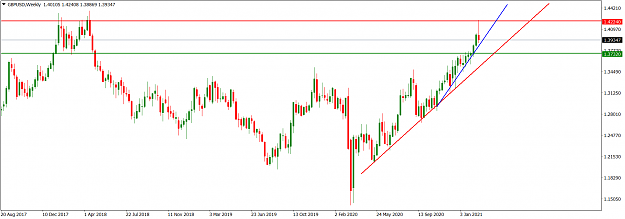
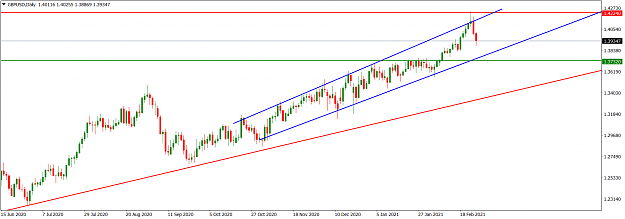
GBPUSD Weekly Technical Outlook

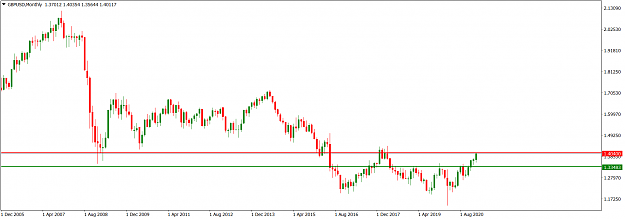
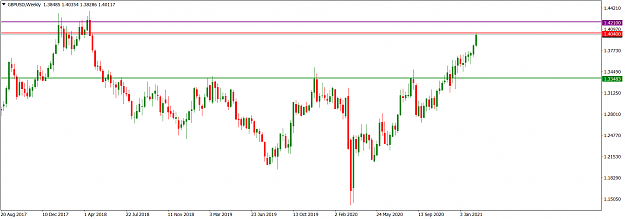
The GBPUSD market has maintained its parabolic northward surge. But will this end as it navigates the 1.40400 multi-year horizontal resistance area? On the monthly time frame, bullish continuation candlesticks have been printed since December 2020 when market operation broke away from the 1.33480 sideways upper area (green). The interim February print is now at the 1.40400 multi-year horizontal resistance area (red).

Attached Image (click to enlarge)
Click to Enlarge

Name: GBPUSDMonthly_Feb 21, 2021.png
Size: 38 KB


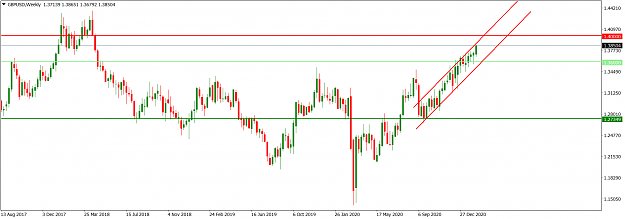
On the weekly time frame, market operation is still in a bullish mode. Last week, a bullish continuation print entered the 1.40400 multi-year horizontal resistance area (red) seen on the monthly time frame. Any further bullish momentum may head for the horizontal resistance extension around 1.42100 (purple).

Attached Image (click to enlarge)
Click to Enlarge

Name: GBPUSDWeekly_Feb 21, 2021.png
Size: 46 KB


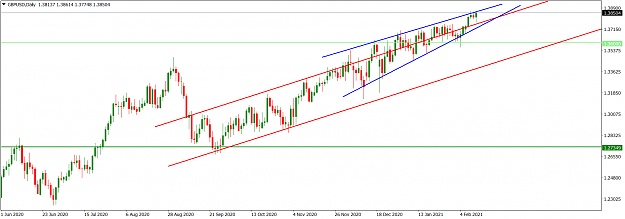
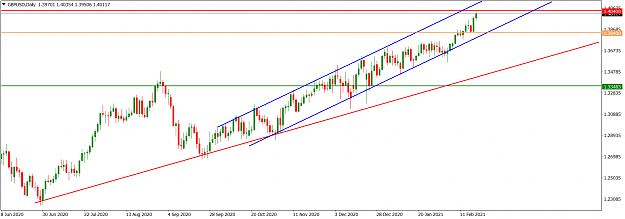
On the daily time frame, price action is operating in a bullish channel (blue) having broken above a rising trendline (red) traceable to June 2020. Presently, price action is near the channel resistance trendline. The bullish print of Friday entered the 1.40400 multi-year horizontal resistance area (red) before it experienced a brief pullback. Any further bullish drive may see it target the channel resistance area or the horizontal resistance extension around 1.42100. However, a significant bearish pressure may see a retest of the minor horizontal support around 1.38400 (sandybrown) or the channel support trendline.

Attached Image (click to enlarge)
Click to Enlarge

Name: GBPUSDDaily_Feb 21, 2021.png
Size: 46 KB


I may be wrong. Trade safe and prosper.

KP
Do your homework, follow the footprints of smart money
1
  • Interactive Trading
  • /
  • Weekly Top-Down Technical Analyses
  • Reply to Thread
    • 1 5455565758 Page 59
    • 1 565758 Page 59
0 traders viewing now
Top of Page
  • Facebook
  • Twitter
About FF
  • Mission
  • Products
  • User Guide
  • Media Kit
  • Blog
  • Contact
FF Products
  • Forums
  • Trades
  • Calendar
  • News
  • Market
  • Brokers
  • Trade Explorer
FF Website
  • Homepage
  • Search
  • Members
  • Report a Bug
Follow FF
  • Facebook
  • Twitter

FF Sister Sites:

  • Metals Mine
  • Energy EXCH
  • Crypto Craft

Forex Factory® is a brand of Fair Economy, Inc.

Terms of Service / ©2021