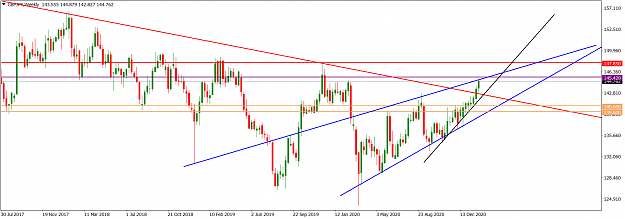
USDCAD Weekly Technical Outlook
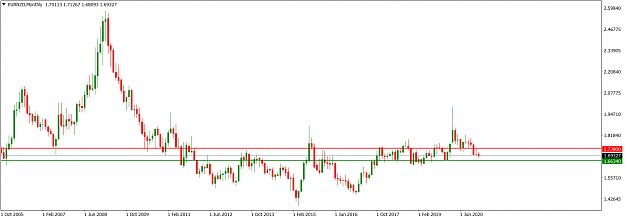
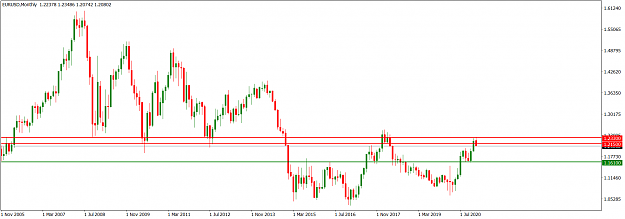
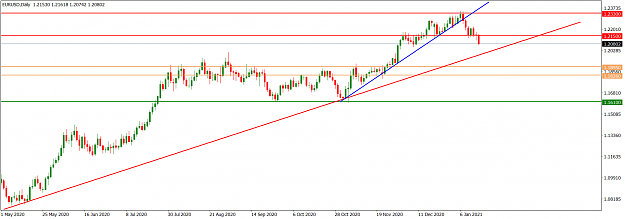
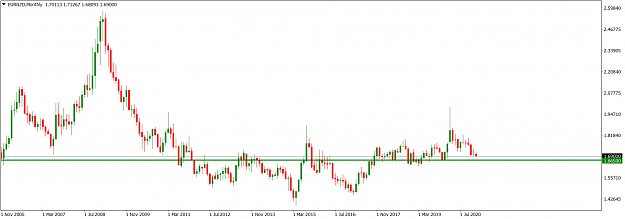
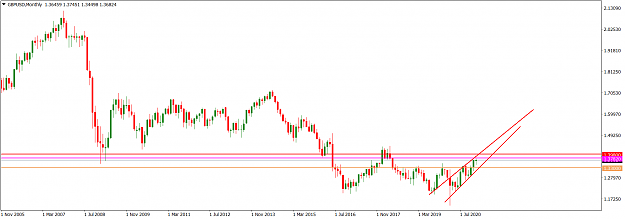
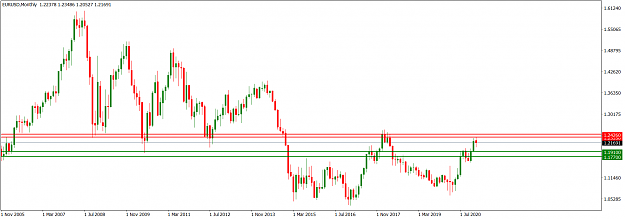
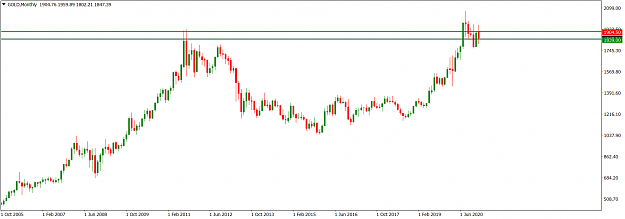
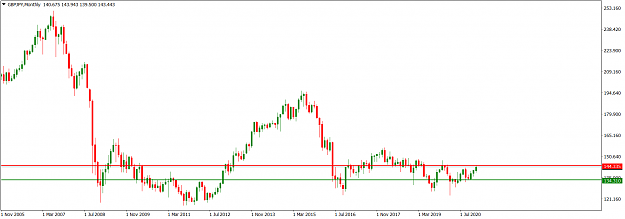
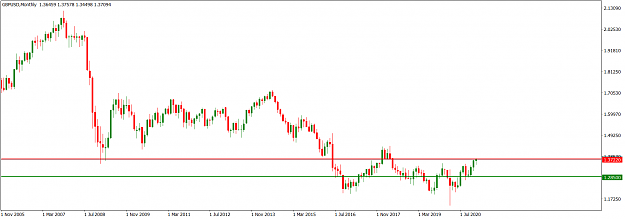
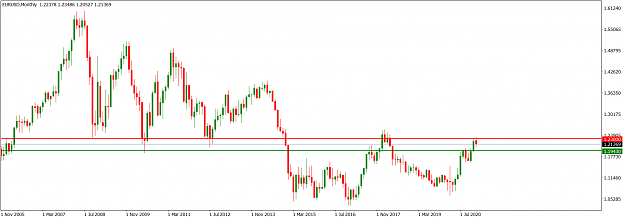
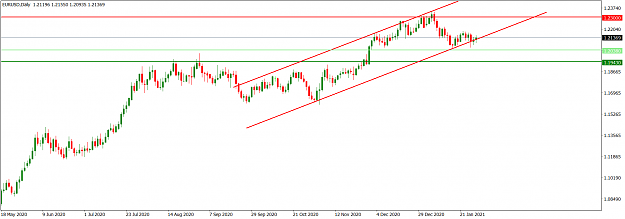
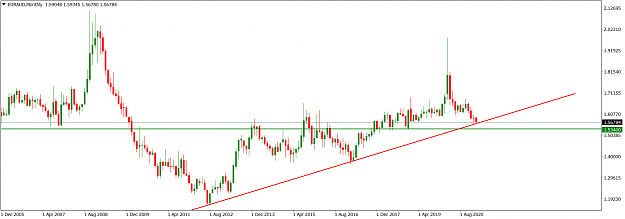
The USDCAD market operation continued its bearish mode in December 2020 after the bearish candlestick printed broke down the 1.29950 horizontal support area (red) flipping it as resistance. The 1.24800 area (green) is the next significant horizontal support on the monthly time frame.
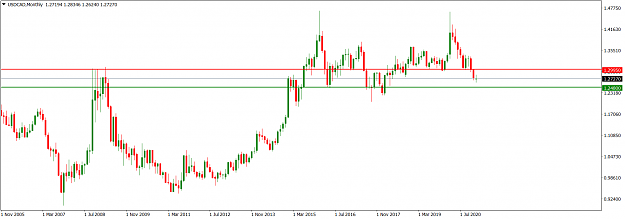
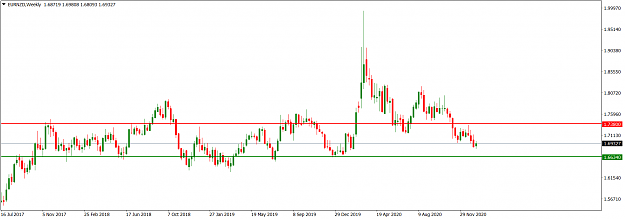
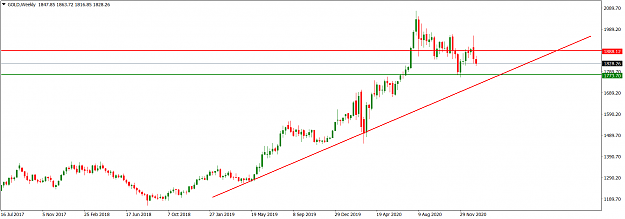
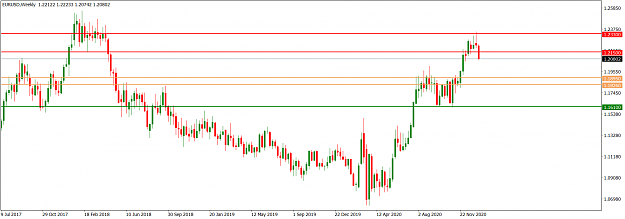
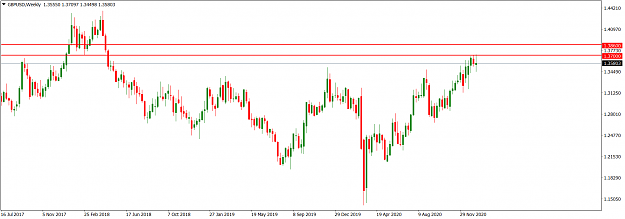
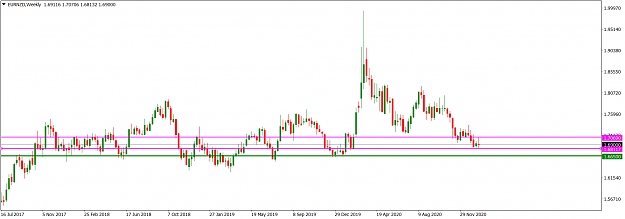
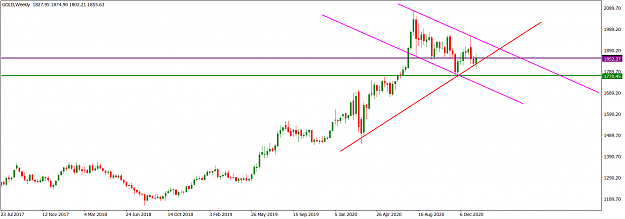
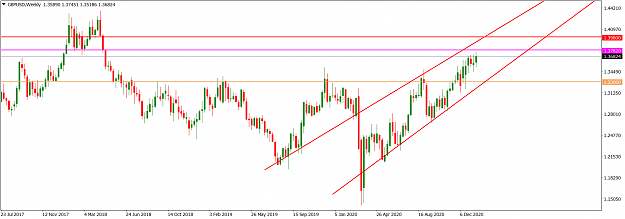
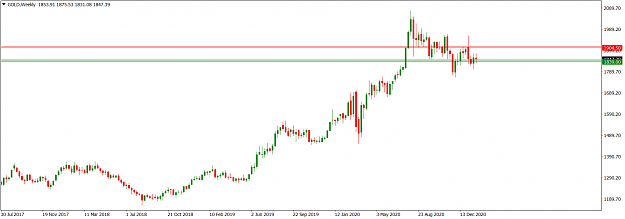
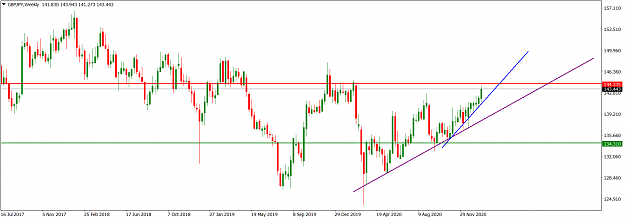
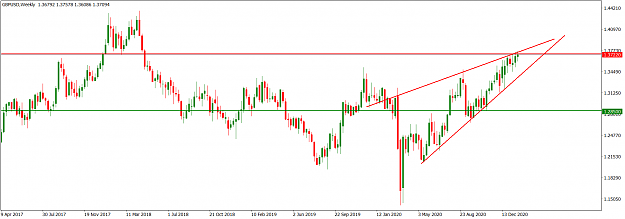
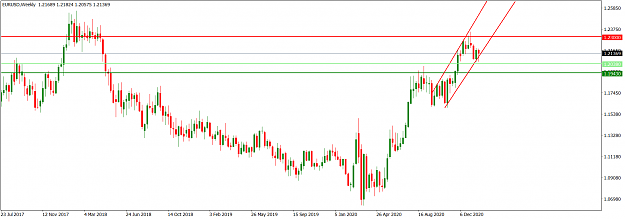
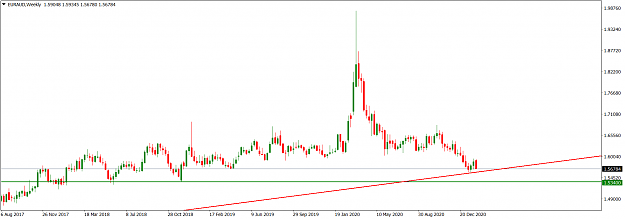
On the weekly time frame, market operation is consolidating and technically poised for a northward retracement. But any such retracement will likely be short-lived.

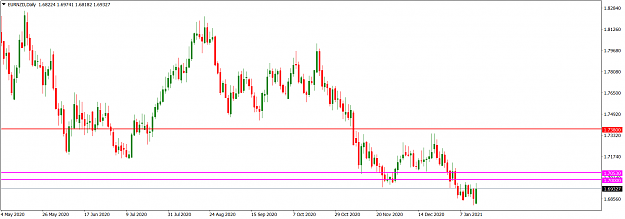
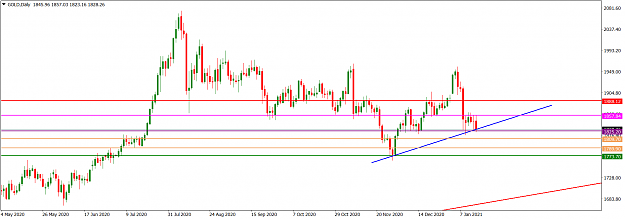
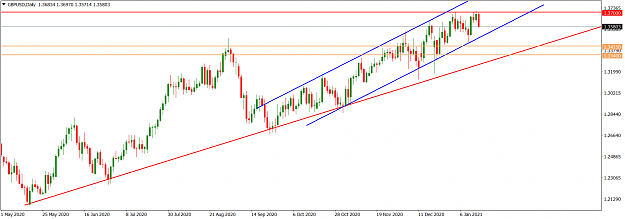
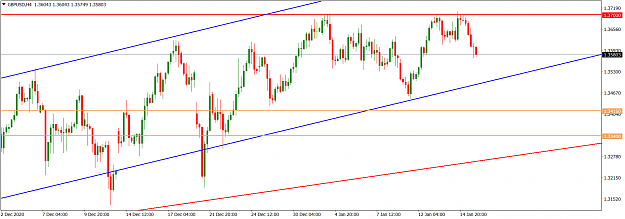
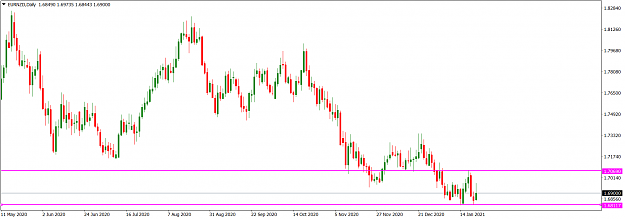
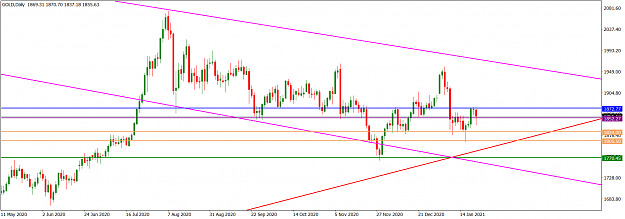
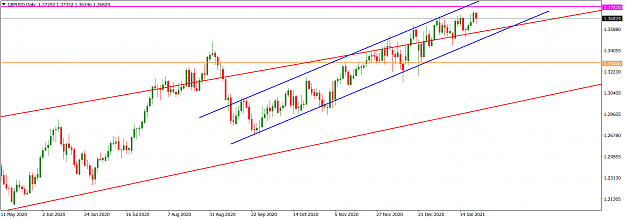
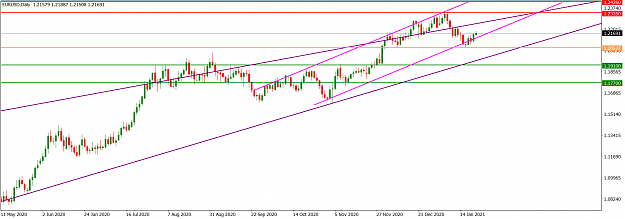
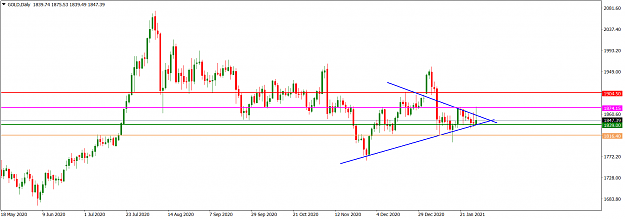
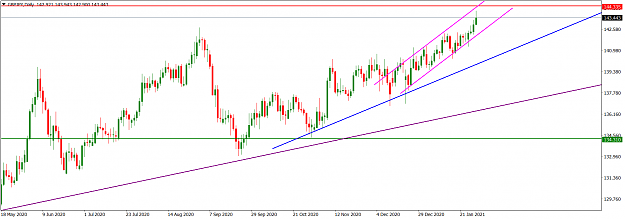
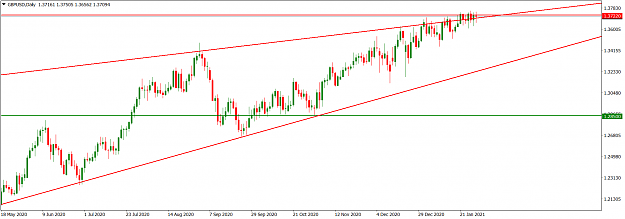
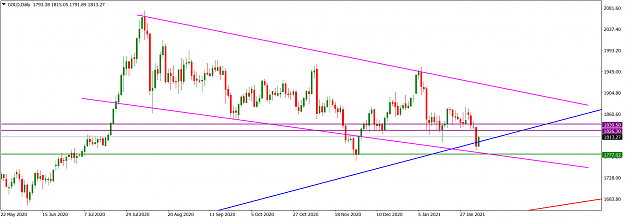
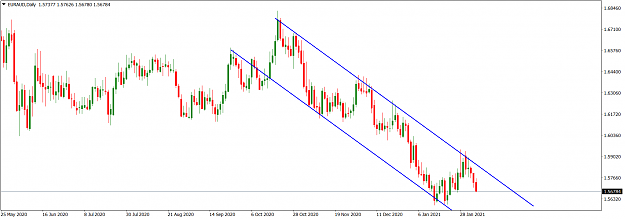
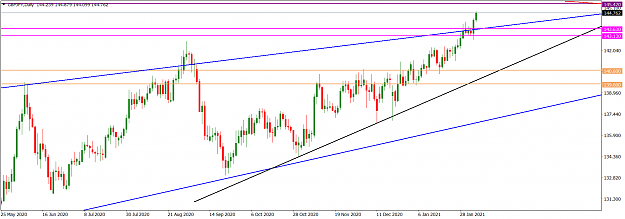
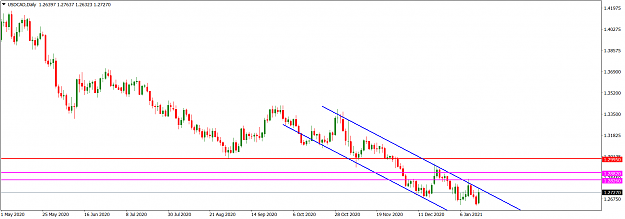
On the daily time frame, price action is within a falling channel (blue). Presently, it is in a bullish mode at the channel resistance trendline. Any further bullish move in the early part of this week is likely to give way to a bearish turnaround at an area of value. Such an area is the 1.28260/1.288200 zone (magenta).
I may be wrong. Trade safe and prosper.
KP
The USDCAD market operation continued its bearish mode in December 2020 after the bearish candlestick printed broke down the 1.29950 horizontal support area (red) flipping it as resistance. The 1.24800 area (green) is the next significant horizontal support on the monthly time frame.
Attached Image (click to enlarge)
On the weekly time frame, market operation is consolidating and technically poised for a northward retracement. But any such retracement will likely be short-lived.
Attached Image (click to enlarge)
On the daily time frame, price action is within a falling channel (blue). Presently, it is in a bullish mode at the channel resistance trendline. Any further bullish move in the early part of this week is likely to give way to a bearish turnaround at an area of value. Such an area is the 1.28260/1.288200 zone (magenta).
Attached Image (click to enlarge)
I may be wrong. Trade safe and prosper.
KP
Do your homework, follow the footprints of smart money