• Home
  • Forums
  • Trades
  • News
  • Calendar
  • Market
  • Brokers
  • Login
  • Join
  • User/Email: Password:
  • 7:46pm
Menu
  • Forums
  • Trades
  • News
  • Calendar
  • Market
  • Brokers
  • Login
  • Join
  • 7:46pm
Sister Sites
  • Metals Mine
  • Energy EXCH
  • Crypto Craft

Options

Bookmark Thread

First Page First Unread Last Page Last Post

Printable Version

Similar Threads

Need Help: Monthly, Quarterly and Yearly Profits Breakdown 6 replies

Trade suppressed FX pairs - collect safe profits 8 replies

ECN && STP && Scalping && Hedging - Broker Review - Oct 2009 24 replies

Stable profits weekly - Monitoring transactions 18 replies

8- Hour's & Yearly Timeframe? 7 replies

  • Trading Systems
  • /
  • Reply to Thread
  • Subscribe
  • 102
Attachments: Stable & safe TREND strategy - 30% to 40% yearly profits
Exit Attachments

Stable & safe TREND strategy - 30% to 40% yearly profits

  • Last Post
  •  
  • 1 56Page 789 10
  • 1 6Page 78 10
  •  
  • Stocks | Brokerage Account XXXXXX66
  • Expand
  • Retract
  • Last Sync: 1 hr 34 min ago
  • Overview

  • Trade Report

  • Trade Graph

  • Trade List

1 hr 34 min ago
Last Sync: 1 hr 34 min ago
  • Overview

  • Trade Report

  • Trade Graph

  • Trade List

  • Period: All History

1 hr 34 min ago
Last Sync: 1 hr 34 min ago
  • Overview

  • Trade Report

  • Trade Graph

  • Trade List

1 hr 34 min ago
Last Sync: 1 hr 34 min ago
  • Overview

  • Trade Report

  • Trade Graph

  • Trade List

1 hr 34 min ago
Last Sync: 1 hr 34 min ago
  • All History
  • Today
  • Yesterday
  • This Week
  • This Month
  • This Year
  • Last Week
  • Last Month
  • Last Year
to
No trading activity in this period.
  • Post #121
  • Quote
  • Jan 4, 2021 10:24am Jan 4, 2021 10:24am
  •  gepards
  • | Joined May 2020 | Status: Member | 147 Posts
Quoting remonpilip
Disliked
{quote} i wonder, do you take into account the slippage? and do u use spread? if no, need to use commission. also in which timeframe u use this EA in? cuz below H1 tfs are usually more expose to over-fitting. (which means that backtest result will not be the same as the actual result)
Ignored
Inserted Code
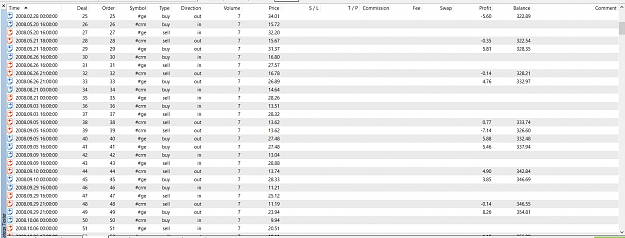
profit = profit + m_Position.Profit() - m_Position.Commission() + m_Position.Swap();

Deals are closed with this method ORDER_FILLING_FOK at this moment in all EAs in this thread. Deviation (or slippage in MT4) is 10 points (1 pip).

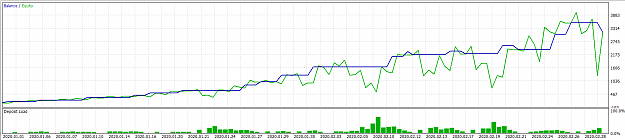
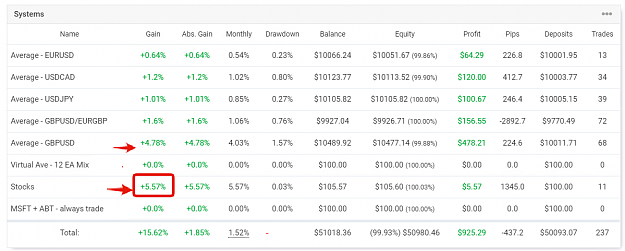
But for stocks will consider another approach because money supply can be limited in stocks - so need to wait for a better time to close so another method might be used - see here methods.
Price always goes somewhere - sooner or later...
1
  • Post #122
  • Quote
  • Jan 6, 2021 3:32am Jan 6, 2021 3:32am
  •  Balurd77
  • | Joined Sep 2016 | Status: Member | 4 Posts
Good morning to all!
Gepard says:" Strategy: Entry Wait when the price goes up X pips open BUY. If goes down X pips - open SELL. Take profit Close deal on TP Y pips."
But... how much is "Y"? Y=X?
Thank you
  • Post #123
  • Quote
  • Jan 7, 2021 5:16pm Jan 7, 2021 5:16pm
  •  gepards
  • | Joined May 2020 | Status: Member | 147 Posts
Quoting Balurd77
Disliked
Good morning to all! Gepard says:" Strategy: Entry Wait when the price goes up X pips open BUY. If goes down X pips - open SELL. Take profit Close deal on TP Y pips." But... how much is "Y"? Y=X? Thank you
Ignored
Each symbol has a different X, Y. Need to optimize.
Price always goes somewhere - sooner or later...
  • Post #124
  • Quote
  • Jan 7, 2021 5:55pm Jan 7, 2021 5:55pm
  •  gepards
  • | Joined May 2020 | Status: Member | 147 Posts
Quoting gepards
Disliked
The next thing which will analyze/backtest is using a hedge between n companies' stocks. When a company has huge dept it performs worse (dive deeper down) in a crisis than a company which debt is smaller. And when the market goes out of the crisis - again companies that have less debt recovery faster. So SELL weak company and BUY a strong company. Will try that.
Ignored
here it is... BUY super strong company CRM (zero debt) and SELL bad company General Electric (debt 2x than company equity).

Attached Image (click to enlarge)
Click to Enlarge

Name: ge_vs_crm.png
Size: 91 KB

Here you see that 2008 crash GE SELL deals made good profits and saved CRM buy deals. Only 3 series was needed to average out.

From 2007 to 2020 max dd 60 usd and profits 854 usd.

Here entry setup:

Attached Image (click to enlarge)
Click to Enlarge

Name: ge_vs_crm_entry.png
Size: 28 KB

As you see when both RSI down then strong company CRM go in BUY but weak company GE let dive deeper and go SELL. Different TF and RSI periods for each symbol but idea seems working.

Attached File
File Type: ex5 Stocks_RSI_EA_V05_hedge.ex5   73 KB | 36 downloads
Attached File
File Type: txt crm_ge_hedge2_set.txt   2 KB | 28 downloads
Price always goes somewhere - sooner or later...
1
  • Post #125
  • Quote
  • Jan 7, 2021 6:13pm Jan 7, 2021 6:13pm
  •  LvMMT
  • Joined Aug 2019 | Status: Member | 112 Posts
Hi everybody,

(4) "Zone Recovery"Trading Algorithm... AND How to Turn ALL of Your Losing Trades into Winners!! - YouTube

This video can help.

God bless everyone!
"the only and sufficient goal of existence is personal development..."
  • Post #126
  • Quote
  • Jan 9, 2021 3:04pm Jan 9, 2021 3:04pm
  •  LvMMT
  • Joined Aug 2019 | Status: Member | 112 Posts
Inserted Video
"the only and sufficient goal of existence is personal development..."
1
  • Post #127
  • Quote
  • Jan 9, 2021 4:00pm Jan 9, 2021 4:00pm
  •  gepards
  • | Joined May 2020 | Status: Member | 147 Posts
Here criteria how to select a stock to trade... liquidity is important:

Quote
Disliked
For a stock to be considered liquid, its shares must be able to be bought and sold quickly and with minimal impact to the stock’s price. According to Canadian regulators, a liquid stock is classified as one that is traded at least 100 times per day and has an average daily trading volume of at least $1 million.
Price always goes somewhere - sooner or later...
1
  • Post #128
  • Quote
  • Edited at 3:35pm Jan 10, 2021 3:08pm | Edited at 3:35pm
  •  gepards
  • | Joined May 2020 | Status: Member | 147 Posts
I setup live account to trade stock #ABT with 100 USD and leverage 1:1.

Strategy:

When Weekly RSI <= 75 open 1 BUY order. Check every 1 hour (starting from NewYork session open) - if price up at least 0.7% then take profits. No SL. Max DD 56%. Average position open time 4 days. Max open time 24 days.

About 40% yearly profits.

Will check liquidity here... Seems about 700k usd daily volume... not 1m... but might work ok.

About 15 deals yearly expected here.

Will use this as signal for etoro stocks trading...
Price always goes somewhere - sooner or later...
  • Post #129
  • Quote
  • Edited at 5:08pm Jan 10, 2021 4:58pm | Edited at 5:08pm
  •  gepards
  • | Joined May 2020 | Status: Member | 147 Posts
I'm looking now at Bitcoin... a nice setup for so-called "whales"... let's say you have 50 BTC. Start selling them on TOP... in our example 40k per btc. Each btc portion you sell impacts the price - it goes down.

Sell 10 btc and price goes down 1% from top price. So 10 btc step is 400 usd.

10 btc * 39600 = 396000 usd
10 btc * 39200 = 392000 usd
10 btc * 38800 = 388000 usd
10 btc * 38400 = 384000 usd
10 btc * 38000 = 380000 usd

So you moved the market... price now moves down an additional 1-4% till calms because of no more sell pressure.

In our example 1 btc now is 36200 usd

Now you start buy at the bottom and price goes up 1% for every 10 btc you purchace

362000 usd = 10 btc
366000 usd = 10 btc
370000 usd = 10 btc
374000 usd = 10 btc
378000 usd = 10 btc

So by selling 50 btc you get 1940000 usd. Then you spent 1850000 usd for buying back. And your total net profit is 90k usd (minus transactions commissions.. 15 usd per transaction or something like that... ) - so total about 4% profit in 2-3 days.

This is just illustrative... how "whales" are making money.

As I see it is nothing unusual for btc to drop 10% in 1 day and then fully recover on 2nd day. btc "whales" are not so big as currencies "whales". maybe about 100 btc is enough to move the market...?

will develop EA to catch those "whales" moves...

Todays btc move was from 41000 till 34500 or 16%. I bet it will recover tomorrow...
Price always goes somewhere - sooner or later...
1
  • Post #130
  • Quote
  • Jan 11, 2021 4:39pm Jan 11, 2021 4:39pm
  •  gepards
  • | Joined May 2020 | Status: Member | 147 Posts
Quoting gepards
Disliked
Todays btc move was from 41000 till 34500 or 16%. I bet it will recover tomorrow...
Ignored
Well... btc didn't recover... went an additional 8% down

Anyway should be enough with 30% to play around with btc... Let's say we have 75usd, split them 3x for 25usd and this is how we operate.... when down 10% open BUY, when still down (now 20%) next BUY when still down - final BUY. Then only wait and pray

Better this could work with stocks... will check with the new EA...

Meanwhile opened several stocks for buy today... all green at the NY session end:

Attached Image (click to enlarge)
Click to Enlarge

Name: stocks.png
Size: 24 KB

Simple entry for stocks... take blue chip companies where weekly RSI (period 5) < 40 and the overall weekly trend in longterm (1-2 years) is up. The goal is 10% of profits. As no leverage used and not CFD but real stocks then can hold those positions quite long... until Biden prints 4T $... If have about 3-4 entries per year - welll... my 40% yearly target can be hit then.
Price always goes somewhere - sooner or later...
1
  • Post #131
  • Quote
  • Jan 12, 2021 10:49am Jan 12, 2021 10:49am
  •  gepards
  • | Joined May 2020 | Status: Member | 147 Posts
It is essential to have at least 3 stocks buy opened. Because there is a risk that some stock goes down forever... Like #GE did it starting from January 2017 - never recovered.

If have 2 more stocks then when seeing a bad move for 1 stock you can get out on break-even or some 2-3% profits for the portfolio. For example if opened #KO buy on January 2017 (both GE and KO had weekly (period 5) RSI below 30 on that month) then in May 2017 get out with 3% profit. Strong stocks compensate losers.
Price always goes somewhere - sooner or later...
  • Post #132
  • Quote
  • Jan 13, 2021 3:00pm Jan 13, 2021 3:00pm
  •  gepards
  • | Joined May 2020 | Status: Member | 147 Posts
Quoting gepards
Disliked
I setup live account to trade stock #ABT with 100 USD and leverage 1:1. Strategy: When Weekly RSI <= 75 open 1 BUY order. Check every 1 hour (starting from NewYork session open) - if price up at least 0.7% then take profits. No SL. Max DD 56%. Average position open time 4 days. Max open time 24 days. About 40% yearly profits. Will check liquidity here... Seems about 700k usd daily volume... not 1m... but might work ok. About 15 deals yearly expected here. Will use this as signal for etoro stocks trading...
Ignored
#ABT hit TP 3% today - 1 day trade. Added to myfxbook

Here myfxbook stats so far:

Attached Image (click to enlarge)
Click to Enlarge

Name: myfxbook.png
Size: 79 KB

For me seems stocks are more perspective. For #ABT will be about 10-15 entries per year. Max 1 trade time ~ 1 month. On average 4 days. Capital is not busy... it can be used for other stock entries too.
Price always goes somewhere - sooner or later...
1
  • Post #133
  • Quote
  • Jan 16, 2021 3:21am Jan 16, 2021 3:21am
  •  gepards
  • | Joined May 2020 | Status: Member | 147 Posts
Look at this "disaster" - GBPUSD H4, open SELL when RSI > 90, open BUY when RSI < 10. Close previous deal when opposite order opened. Open additional deal when left RSI zone for signal and then re-entered again that zone (without opened opposite deal).

Attached Image (click to enlarge)
Click to Enlarge

Name: gbpusd_disaster.png
Size: 38 KB

Can you see the beauty behind this mess?

Here it is..

Attached Image (click to enlarge)
Click to Enlarge

Name: gbpusd_beauty.png
Size: 31 KB

From 100 usd 3300 usd profits in 3 months. With stupid strategy...

And here a revelation of the secret ...

This applies to any strategy. There are periods when any strategy works fine and then it fails. Idea is to find a strategy that fails for example 3-5 times per year but all the rest it works great. And then aggressively scale when it works and cashout smart (not be too greedy). For example, allocate 1000 usd. Split per 100 usd - charge account. And start the ride. When profits 2000 usd (see backtests/optimizations best target when stop scaling) - cashout and restart on 200 usd. Will backtest this approach now.
Price always goes somewhere - sooner or later...
2
  • Post #134
  • Quote
  • Jan 16, 2021 9:08am Jan 16, 2021 9:08am
  •  ryuryu
  • Joined Apr 2020 | Status: degen gambler | 375 Posts
Quoting gepards
Disliked
maybe about 100 btc is enough to move the market...?
Ignored

In 2017-18 it was about 2000 BTC needed to move market +/- 5-7%.

Quoting gepards
Disliked
This applies to any strategy. There are periods when any strategy works fine and then it fails. Idea is to find a strategy that fails for example 3-5 times per year but all the rest it works great. And then aggressively scale when it works and cashout smart (not be too greedy). For example, allocate 1000 usd. Split per 100 usd - charge account. And start the ride. When profits 2000 usd (see backtests/optimizations best target when stop scaling) - cashout and restart on 200 usd. Will backtest this approach now.
Ignored
Read this:
https://www.forexfactory.com/thread/...20#post2212020
Especially this:
2. Make sure that EVERYTHING is measurable and defined. If not, then your system will have elements of inconsistency. Wishful thinking prays on these little pockets of testing-inconsistency, and can significantly distort your statistical expectation if you allow it to leak into a system that is crafted with anything less than 100% precision.
greed and fear
1
  • Post #135
  • Quote
  • Edited at 5:05pm Jan 16, 2021 4:43pm | Edited at 5:05pm
  •  gepards
  • | Joined May 2020 | Status: Member | 147 Posts
Quoting ryuryu
Disliked
{quote} In 2017-18 it was about 2000 BTC needed to move market +/- 5-7%. {quote} Read this: https://www.forexfactory.com/thread/...20#post2212020 Especially this: 2. Make sure that EVERYTHING is measurable and defined. If not, then your system will have elements of inconsistency. Wishful thinking prays on these little pockets of testing-inconsistency, and can significantly distort your statistical expectation if you allow it to leak into a system that is crafted with anything less than 100% precision.
Ignored
Regarding this statement:

Quoting topherhk88
Disliked
Make sure that your sample size is suitably large. Constructing a system over 50-100 or so trades is complete foolishness, and 'curve-fitting', in the negative sense of the word (with the arduous strategy above being in the more positive sense). You are a scientist, and you need enough results to formulate a plausible market theory.
Ignored
Seems I will break that rule.
Price always goes somewhere - sooner or later...
  • Post #136
  • Quote
  • Edited at 5:45pm Jan 17, 2021 5:21pm | Edited at 5:45pm
  •  gepards
  • | Joined May 2020 | Status: Member | 147 Posts
Added to my stocks account (leverage 1:1) 14 EAs setups. All with normal TP/SL and dynamic TP/SL based on RSI value. Various timeframes - short-term (from 5 minutes deals) to long-term (several months) setups. Target about 30-40% yearly profits. Combined drawdown about 10%. SELL and BUY deals. So make profits in crashing markets too (actually the best performance in March/April 2020). Some setups generate more than 700 trades in 3 years. Some only ~15-25 trades (but ride winners longer).

Here combained results to calculate total drawdown and total profit for all stocks:

Attached File
File Type: xlsx AssetReport_Stocks RSI.xlsx   143 KB | 17 downloads

Here not visible equity... only balance drawdowns. As I saw in backtests then can assume that equity can be 2x more down. So let it be 10% expected total combined drawdown. I'm ok with 20% dd - so if all goes good will double trading volumes to target 60-80% yearly profits.

Will test liquidity. Never traded stocks seriously...Let's see how will close deals on a live account...
Price always goes somewhere - sooner or later...
2
  • Post #137
  • Quote
  • Jan 21, 2021 2:33pm Jan 21, 2021 2:33pm
  •  gepards
  • | Joined May 2020 | Status: Member | 147 Posts
Quoting gepards
Disliked
Let's see how will close deals on a live account...
Ignored
At this moment seems all works fine. Already more than 9 deals opened/closed.

Created another account (another broker with leverage for stocks 1:5) with 2 nice setups for #ABT and #MSFT. Microsoft stocks in 3 years were 30 deals and made from 100 usd 600 usd profits (with scaling - increase volume gradually on account growth). BUY and SELL deals for both. #ABT will trade with more frequency - 150 deals in 3 years.

Here interesting setup - both stocks always trading.. when SELL closed then BUY immediately opened and vice versa. Read somewhere in the forum question "When is the best time to close SELL?" Answer: "when is the best time to enter BUY" (and vice versa). Made something similar approach.

Added to myfxbook portfolio this new account too.
Price always goes somewhere - sooner or later...
  • Post #138
  • Quote
  • Jan 21, 2021 2:39pm Jan 21, 2021 2:39pm
  •  gepards
  • | Joined May 2020 | Status: Member | 147 Posts
Quoting gepards
Disliked
For me seems stocks are more perspective.
Ignored
And here it is - stocks EAs beat currencies EAs just in 2 weeks - already 5.57% in profits:

Attached Image (click to enlarge)
Click to Enlarge

Name: stocks_beat_currencies.png
Size: 127 KB

I have more confidence in stocks versus currencies EAs (with averaging). Because stocks EAs work with normal SL/TP approach while currencies EAs using averaging (ok backtested 10 years, no more than 50% dd etc... but still...)
Price always goes somewhere - sooner or later...
1
  • Post #139
  • Quote
  • Jan 24, 2021 9:57am Jan 24, 2021 9:57am
  •  gepards
  • | Joined May 2020 | Status: Member | 147 Posts
Added SP500 EA setup to myfxbook portfolio. Leverage 1:10 for indexes.

It is always in BUY or in SELL deal. When BUY close - opening SELL. Again RSI used.

Attached Image (click to enlarge)
Click to Enlarge

Name: sp500_growth.png
Size: 36 KB

Attached Image (click to enlarge)
Click to Enlarge

Name: sp500_real_ticks.png
Size: 41 KB

It performed very well in 2020. March crash.

2018: 30% profits
2019: 60% profits
2020: 200% profits
Price always goes somewhere - sooner or later...
1
  • Post #140
  • Quote
  • Jan 25, 2021 5:57pm Jan 25, 2021 5:57pm
  •  guilionzo
  • | Joined Sep 2020 | Status: Junior Member | 1 Post
Hi Gepards,

I've optimazed the EA and the results are very interisting. I tried to run on demo, but I received the following message: EA in development mode. Only strategy tester posible for now...

I'd like to know whether you will share the source code or a runable version that can be executed on demo accounts?

I apreciate your time and effort. Nice EA

Best regards,
  • Trading Systems
  • /
  • Stable & safe TREND strategy - 30% to 40% yearly profits
  • Reply to Thread
    • 1 56Page 789 10
    • 1 6Page 78 10
0 traders viewing now
  • More
Top of Page
  • Facebook
  • Twitter
About FF
  • Mission
  • Products
  • User Guide
  • Media Kit
  • Blog
  • Contact
FF Products
  • Forums
  • Trades
  • Calendar
  • News
  • Market
  • Brokers
  • Trade Explorer
FF Website
  • Homepage
  • Search
  • Members
  • Report a Bug
Follow FF
  • Facebook
  • Twitter

FF Sister Sites:

  • Metals Mine
  • Energy EXCH
  • Crypto Craft

Forex Factory® is a brand of Fair Economy, Inc.

Terms of Service / ©2021