USDCAD Weekly Technical Outlook
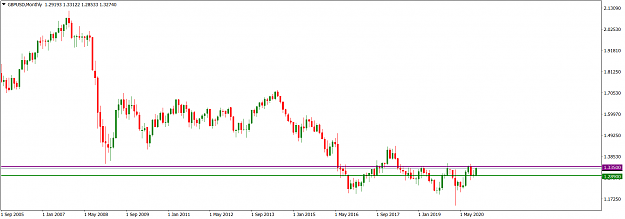
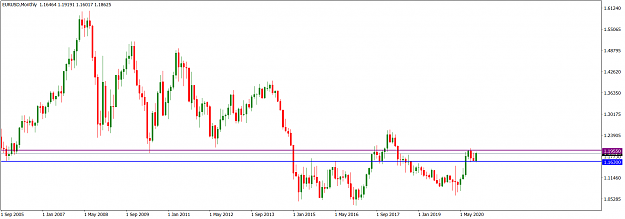
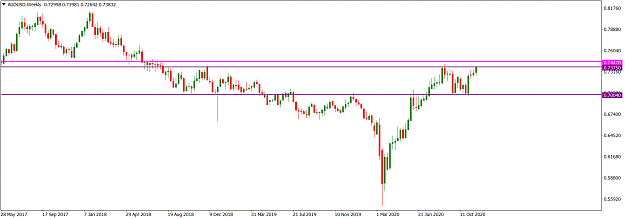
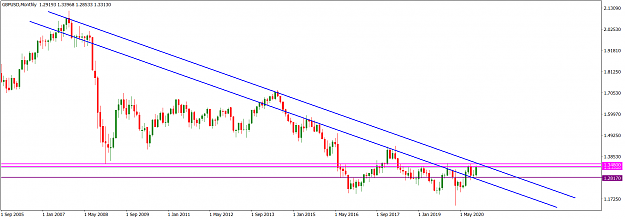
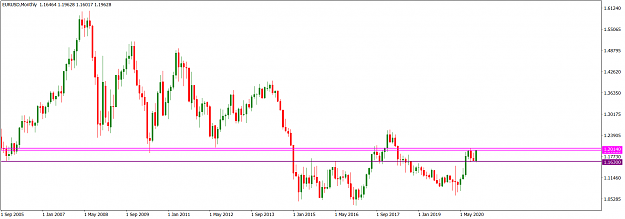
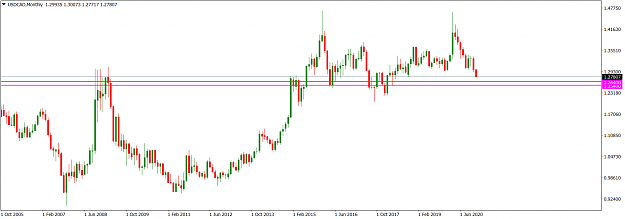
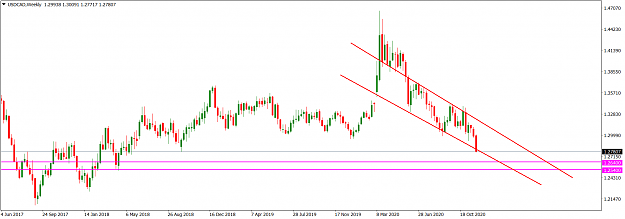
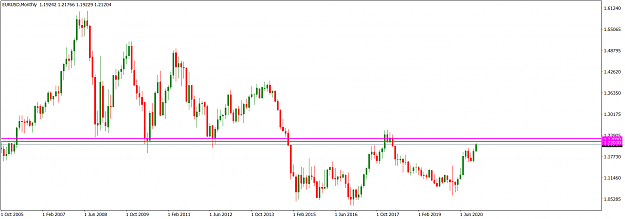
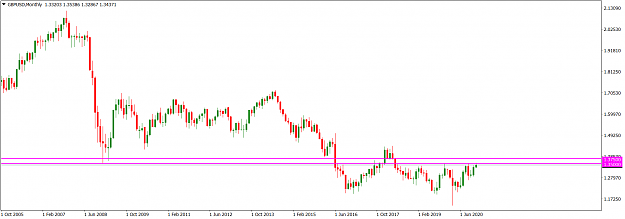
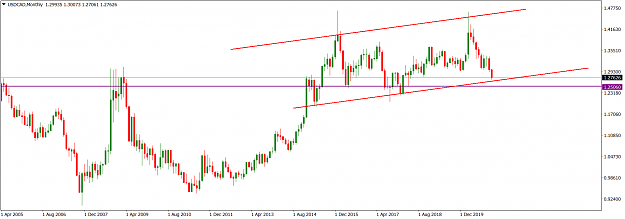
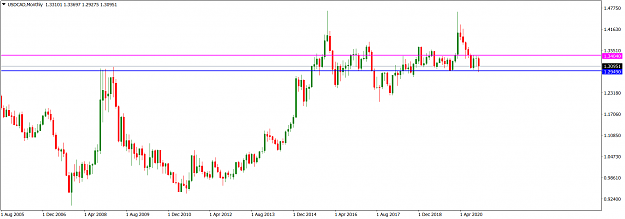
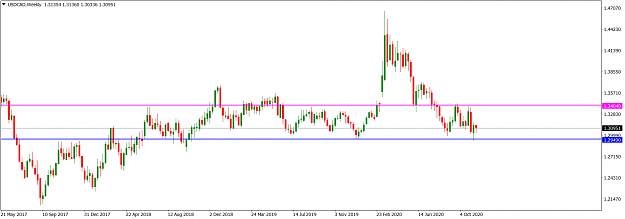
The 1.29490 area (blue) has held as a horizontal support on the USDCAD monthly time frame since December 2019. This month, a bearish market operation pierced the area before retracing northward. The 1.34040 area (magenta) is the prevailing horizontal resistance.
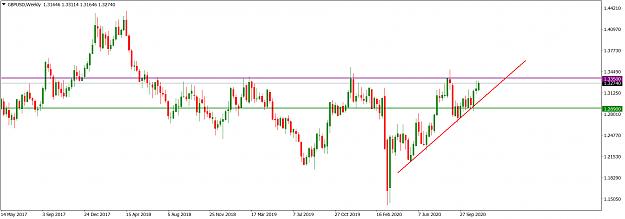
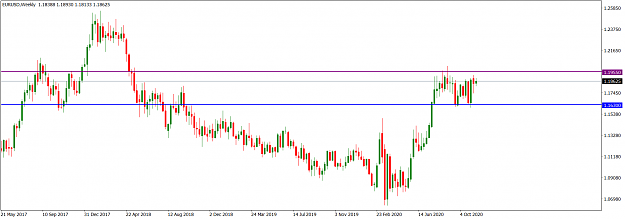
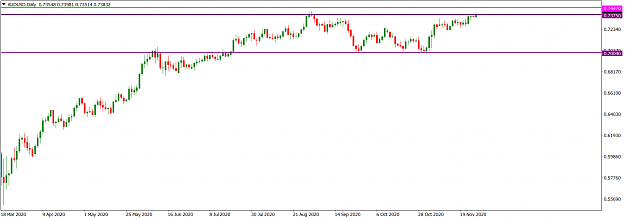
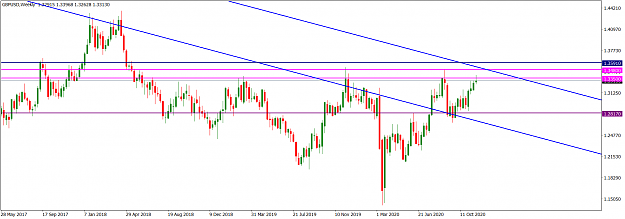
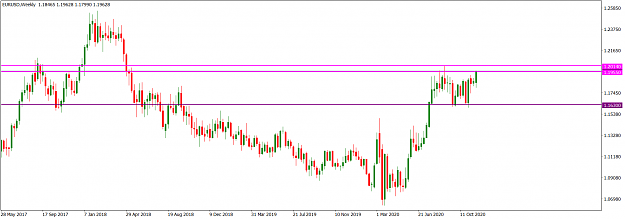
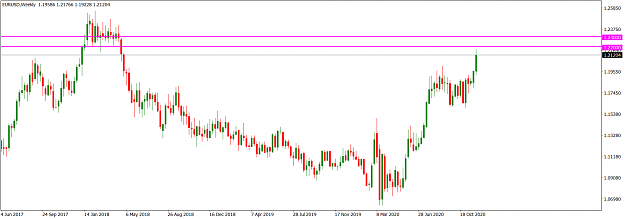
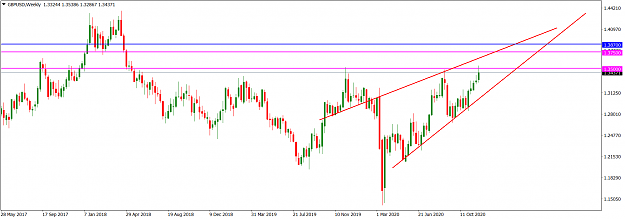
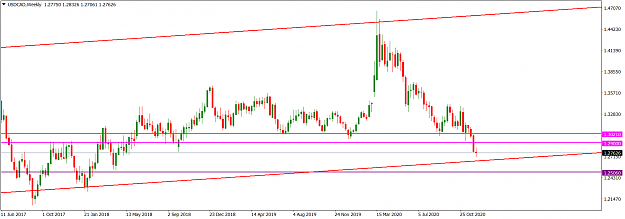
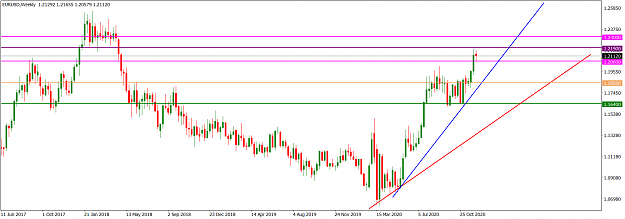
USDCAD weekly market operation has been choppy within the 1.29490/1.34040 zone for quite a while. Two weeks ago a bullish candlestick was printed from the 1.29490 horizontal support area but last week a bearish candlestick print was initiated which failed to breach the low of the bullish print of two weeks ago, resulting in a relatively smaller bearish print with a lower shadow; this indicating that bulls are still influential in the market.
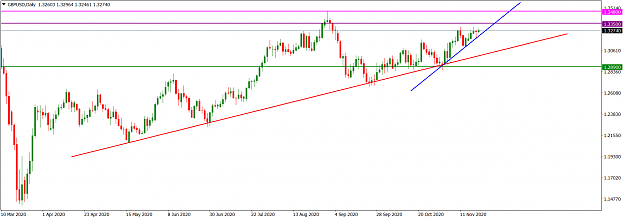
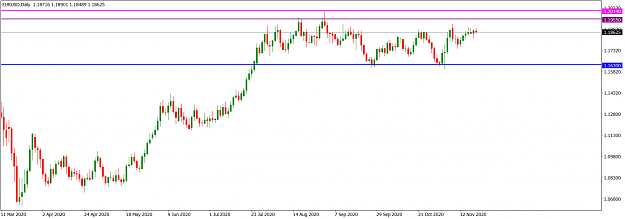
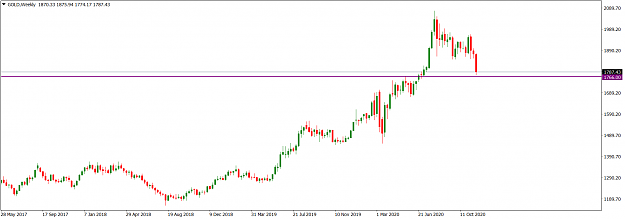
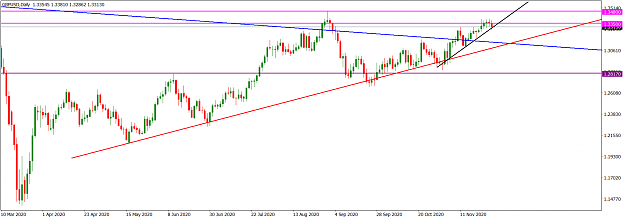
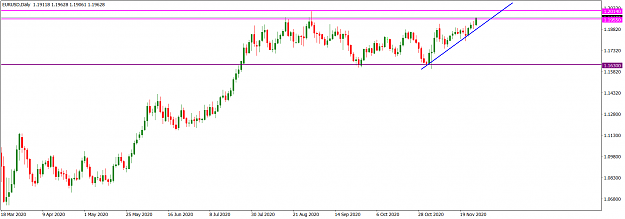
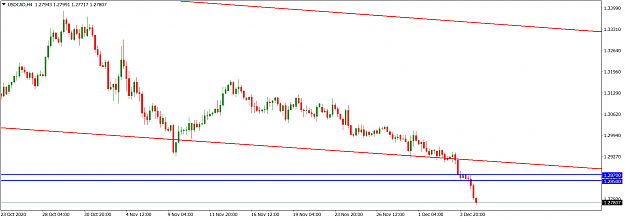
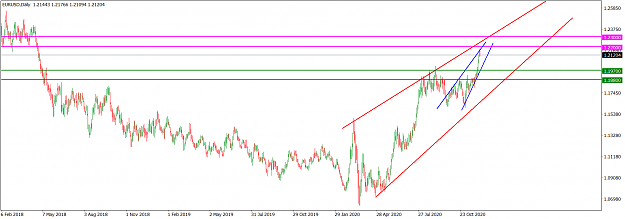
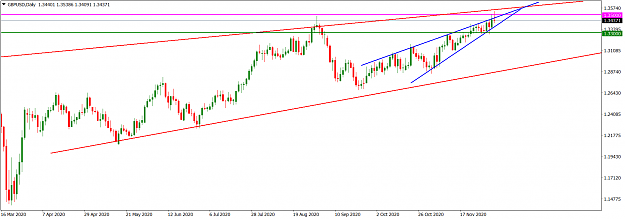
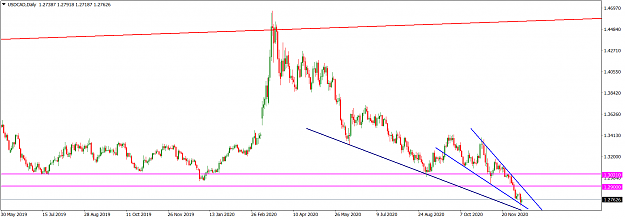
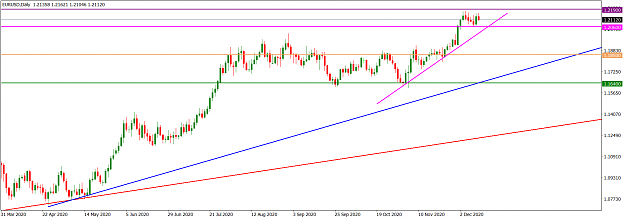
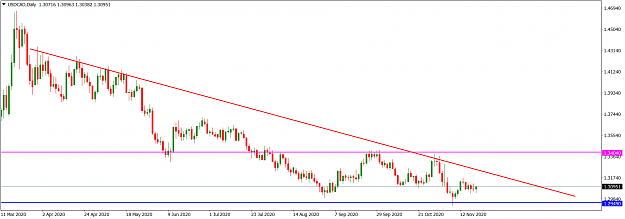
Recent price action on the daily time frame has been sideways. Besides, the candlestick prints of the last four days have been relatively small, which indicates market indecision. We should await what happens u=in the early part of this week for directional clarity although the falling trendline (red) traceable to March 2020 is still intact.
I may be wrong. Trade safe and prosper.
KP
The 1.29490 area (blue) has held as a horizontal support on the USDCAD monthly time frame since December 2019. This month, a bearish market operation pierced the area before retracing northward. The 1.34040 area (magenta) is the prevailing horizontal resistance.
Attached Image (click to enlarge)
USDCAD weekly market operation has been choppy within the 1.29490/1.34040 zone for quite a while. Two weeks ago a bullish candlestick was printed from the 1.29490 horizontal support area but last week a bearish candlestick print was initiated which failed to breach the low of the bullish print of two weeks ago, resulting in a relatively smaller bearish print with a lower shadow; this indicating that bulls are still influential in the market.
Attached Image (click to enlarge)
Recent price action on the daily time frame has been sideways. Besides, the candlestick prints of the last four days have been relatively small, which indicates market indecision. We should await what happens u=in the early part of this week for directional clarity although the falling trendline (red) traceable to March 2020 is still intact.
Attached Image (click to enlarge)
I may be wrong. Trade safe and prosper.
KP
Do your homework, follow the footprints of smart money