{quote} EU and GU are not the same...that dollar chart applies to EU only...GU is doing its own thing always, anyway...it can move few hundred pips without EU or the USDx chart moving.
Ignored
Or do you mean, according to your analysis, it applies to EU only?
{quote} EU and GU are not the same...that dollar chart applies to EU only...GU is doing its own thing always, anyway...it can move few hundred pips without EU or the USDx chart moving.
Ignored
What makes you think GU does it's own thing always?
Overlay GU and USDindex monthly/weekly chart, and you will see a high degree of inverse correlation.
{quote} What makes you think GU does it's own thing always? Overlay GU and USDindex monthly/weekly chart, and you will see a high degree of inverse correlation.
Ignored
I was posting the correlation numbers here in the past...EU and USDx are correlated 90%+ most of the time, while GU and USDx had an average between 50-70%, during certain periods only 25%. You never noticed how GU is sometimes doing its own thing, completely unrelated to dollar?
I would say GU is driven 70-80% by the pound. EU is 50% euro 50% USD mostly.
Everyone can see the chart, but only a few can actually read it.
O.K , Friday was a disappointing day .
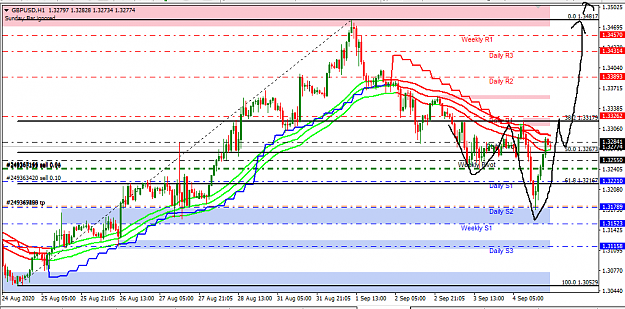
i started usually from 280 $ went up to 440 $ but a Stupid mistake putting the tp at the horizontal line at 1.31600 and not at daily s2 at 1.31800 , cause me to stay in the position and lose all the profit and a little more , so now i back at the stating point again , 240 $.
time to re group .
to clear my head .
feel humble again.
i will get out from my short positions at the start of the next week .
i will wait for the market to tell me where he want to go .
i will aim to a 30 $ a day , that will pay my rent if i sec seed .
if it will be more , i will be great full, but not disappointment if not .
O.K , Friday was a disappointing day . i started usually from 280 $ went up to 440 $ but a Stupid mistake putting the tp at the horizontal line at 1.31600 and not at daily s2 at 1.31800 , cause me to stay in the position and lose all the profit and a little more , so now i back at the stating point again , 240 $. time to re group . to clear my head . feel humble again. i will get out from my short positions at the start of the next week . i will wait for the market to tell me where he want to go . i will aim to a 30 $ a day , that will pay my rent...
Ignored
not worry
imo, price possible back to weekly pivot, (high risk)
{quote} I was posting the correlation numbers here in the past...EU and USDx are correlated 90%+ most of the time, while GU and USDx had an average between 50-70%, during certain periods only 25%. You never noticed how GU is sometimes doing its own thing, completely unrelated to dollar? I would say GU is driven 70-80% by the pound. EU is 50% euro 50% USD mostly.
Ignored
Yes you're right, it looks very much like the GBP chart
All i had to do was hold the fucking position , Like my wife always says. i got shaken out. I noticed the Unemployment rate numbers were positive, rushed to clear my SL and just when i was to confirm the trade, I was out. i couldve reloaded my position but i wanted to take the loss for training my psychological losing state, be able to accept these. Live and you learn. Congratulations to all the Winners. You deserve it! {image}
Ignored
Hey Kampion, we've all been there and sure I'll be there many more times
43 dollar loss is nothing to be stressed about, Seriously
How about when you move up to trading 5-6 lots and the spread costs 40 bucks
Over here in Australia it was 2.30 am too late so closed some losing positions only to see Cable rise another 60 pips after I woke up. Pretty much did myself out of $800. Thing is as you can see by weekly stat already up heaps so no big deal
{quote} I was posting the correlation numbers here in the past...EU and USDx are correlated 90%+ most of the time, while GU and USDx had an average between 50-70%, during certain periods only 25%. You never noticed how GU is sometimes doing its own thing, completely unrelated to dollar? I would say GU is driven 70-80% by the pound. EU is 50% euro 50% USD mostly.
Ignored
I love Rally days when all Pound pairs are rallying and Cable says "Get the fuck outta my way"......
There are also times when EU and that blood sucking freak EG are falling while Cable is rising
O.K , Friday was a disappointing day . i started usually from 280 $ went up to 440 $ but a Stupid mistake putting the tp at the horizontal line at 1.31600 and not at daily s2 at 1.31800 , cause me to stay in the position and lose all the profit and a little more , so now i back at the stating point again , 240 $. time to re group . to clear my head . feel humble again. i will get out from my short positions at the start of the next week . i will wait for the market to tell me where he want to go . i will aim to a 30 $ a day , that will pay my rent...
Ignored
moty, I look at the loading chart and see that the solution ot is in your hands.
i don't understand why you don't notice.
{quote} What makes you think GU does it's own thing always? Overlay GU and USDindex monthly/weekly chart, and you will see a high degree of inverse correlation.
Ignored
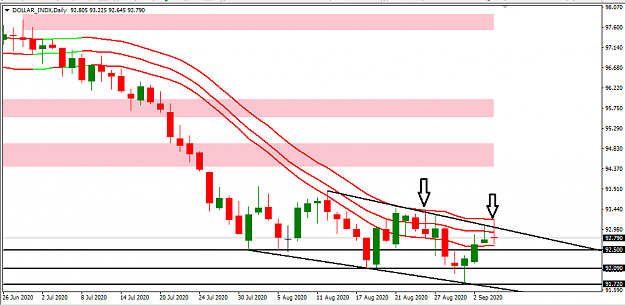
It's a weighted index .
It looks like it, because $ is doing all the work currently
(EUR), 57.6% weight. (CHF) 3.6% weight
(JPY) 13.6% weight
(GBP), 11.9% weight
(CAD), 9.1% weight
(SEK), 4.2% weight
On-site guru & also FF member's' psychiatrist, when not drinking tea
Joined Nov 2007
|
Status: left CanaryWharf desk-tea break
|24,286 Posts
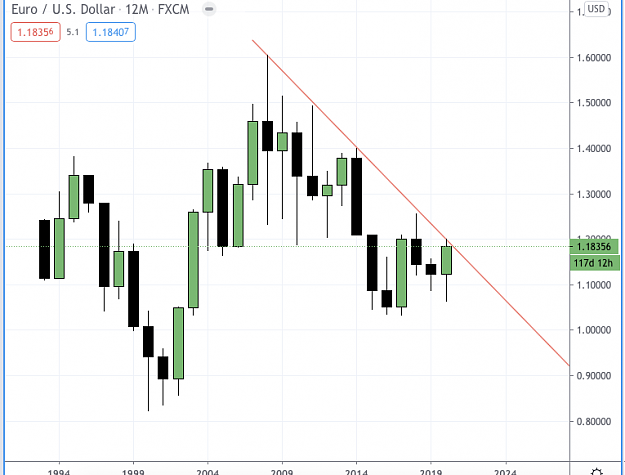
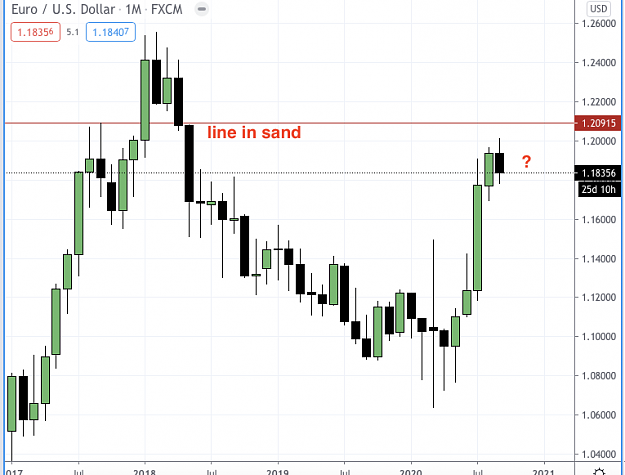
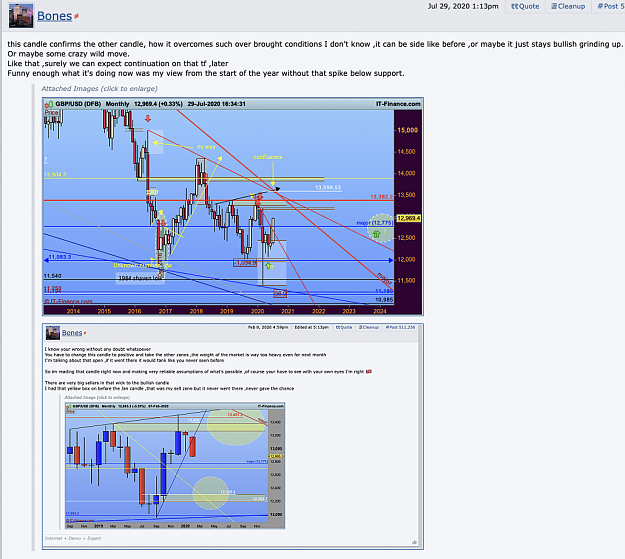
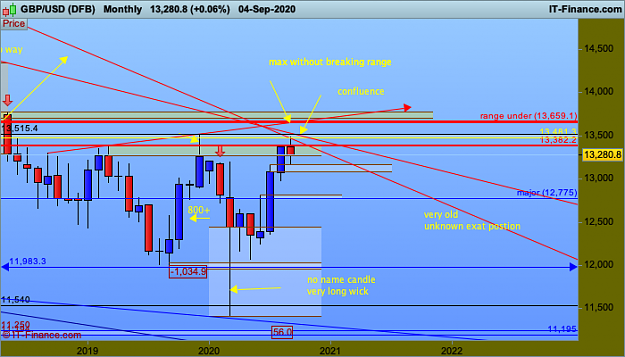
I don't think eur is over its line ,the line is at a major pivot point
its consolidating weekly
which is likely bearish
I used yearly because its so old
If this monthly can carry on over that pivot then it broke
Attached Image(s) (click to enlarge)
On-site guru & also FF member's' psychiatrist, when not drinking tea
Joined Nov 2007
|
Status: left CanaryWharf desk-tea break
|24,286 Posts
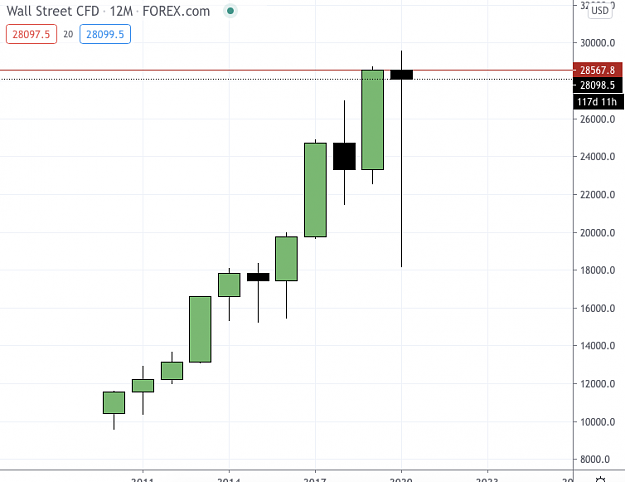
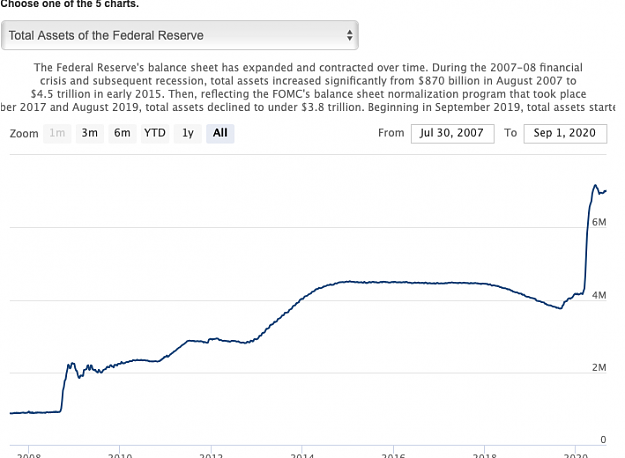
If we look at the dow ,it must be in a sell zone ,to go up further than the high would be outrageous ,with that massive wick
The Fed have allowed anyone to get out as far as Im concerned
Completely fake government policy driven market, which probably spilt over to other risky assets.
Note it's the yearly ,which can take time to evolve.Only one condition =not to go higher than the high or say RN 30 max.
side or down on monthly next...
Attached Image(s) (click to enlarge)
On-site guru & also FF member's' psychiatrist, when not drinking tea
Joined Nov 2007
|
Status: left CanaryWharf desk-tea break
|24,286 Posts
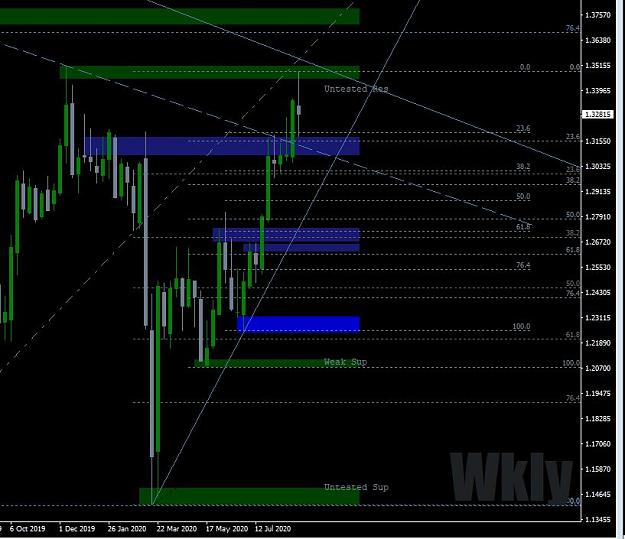
Could be thats how it hits the major line ,I'm looking short under the pivot but Friday it did respect the up tl pivot.
Cable may not have hit its line at all ,weekly maybe a warning
Attached Image (click to enlarge)
On-site guru & also FF member's' psychiatrist, when not drinking tea
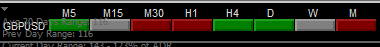
Friday's pip range @ 143 was 123% of the 30 day adr. The week just closed @ 272 was 112% of the 13 week awr, and so far this month price has traveled 53% of the 4mth amr.
The much anticipated correction from the prev sw hi zone on dly-mthly that extends to 3515 finally happened re the 1hr-weekly pa uptrends, ie 3482-3075 (so far,) ie just over 300 pips with Tuesday's daily pinbar signalling that a continued pullback/deeper correction from it's 3482 hi was the higher probability. A smart bounce back by the bulls from 3175 - Friday's Daily S2/lo/weekly lo came about after the post NFP drop.
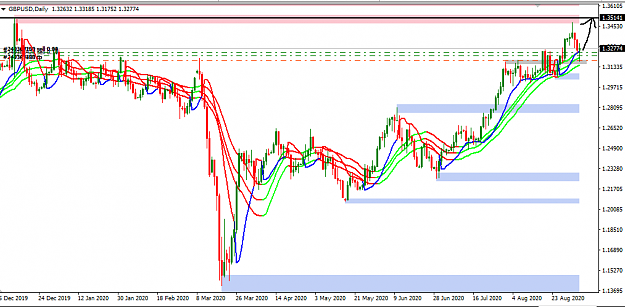
The 20/50/100 ema crosses are as shown below.
Wkly.
No fractal print is created by the weekly candle close which closes as a bearish bodied spinning top-esq candle. This t/f remains in a general pa uptrend. At friday's lo price found support at the top of the weekly prev sw hi x 2 zone that likely extends down to circa 3087. This t/f has a big drop before the last HL which means that a new HL could form much further down if the general pa uptrend is to continue on this t/f. Interesting that the last 2 such weekly candles as described above have resulted in a bullish continuation in the run up from 2252. Not a huge sample lol - but will this history repeat ?
Dly.
This t/f remains in a general pa uptrend with the 3482 hi from Tues being the last HH printed in it on this t/f. No fractal print created by close of Friday's bullish pinbar but if it turns fractal by the close of Monday's candle, it will be at another HL which would occur so long as it holds above 3051, even though an asc t/line break may result on this t/f. Only a break below this level would damage the current general pa uptrend on this t/f, although not necessarily fatally.
4Hr.
This t/f is in a classic pa downtrend although it's ema's remain crossed up (as another measure of trend.) ...Friday's lo came at a prev 4hr sw lo zone = prev supp=pot supp that extends down to 3160 and bullish hidden div was evident there on the 4hr osc's and is on this t/f so long as 3160 holds. The last 4hr candle close was bullish off the bullish inverted hammer before it. No fractal print was caused by the close of this candle on this t/f. An upside break above the last LH @ 3319 would relieve some of the bearish pressure re this t/f.
1Hr
This t/f remains in a general pa downtrend with it's ema crosses confirming this. Friday's DP and 38.2% of the total 3482-3175 is @ the pullback hi off the 3175 lo....which was a pretty V shaped move on this t/f. No fractal print was created by the last 1hr close which is a bullish pinbar. An upside break above the same level mentioned in 4hr analysis above would relieve some of the bearish pressure on this t/f.
Conclusion/Likely near-term direction
The weekly indecision candle says it all really, and makes the near term direction hard to read overall. Certainly on t/f's 1hr to daily more upside seems probable despite the lower 2 of those t/f's being in general pa downtrends, but whether Friday's daily candle and the 4hr bullish hidden div will result in a new daily + uptrend hi above 3482 - I have no real idea.
Joined Jul 2009
|
Status: The Alchemist
|8,917 Posts
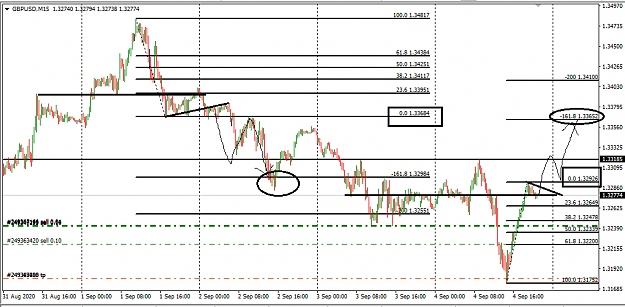
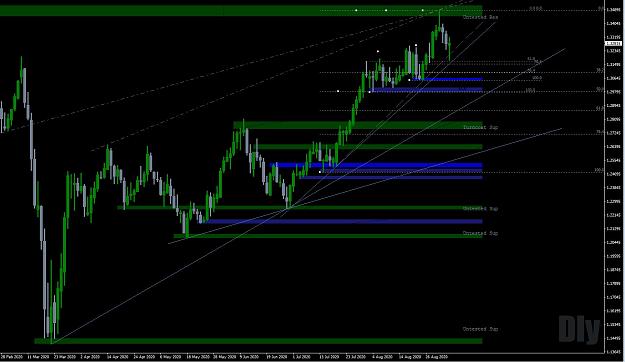
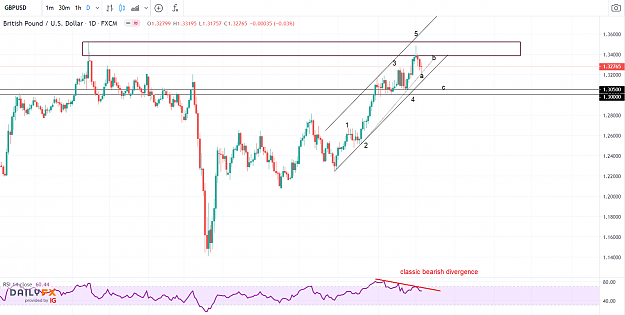
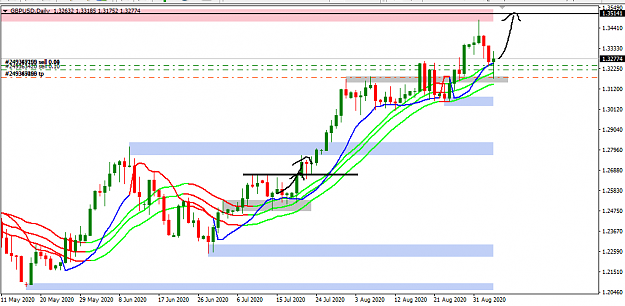
Daily chart remains bullish against structural supports @ 1.3050 and 1.30, and the rising TL. However, considering the strong rejection before 1.35, the bearish divergence, and possible abc correction, it may correct lower after an initial up move (wave b)
Daily chart remains bullish against structural supports @ 1.3050 and 1.30, and the rising TL. However, considering the strong rejection before 1.35, the bearish divergence, and possible abc correction, it may correct lower after an initial up move (wave b) {image}
Ignored
I think double top abc is bullish continuation ?
Attached Image (click to enlarge)
On-site guru & also FF member's' psychiatrist, when not drinking tea