I think I understand what u are saying.... many thks
My understanding of Gann is that he explored the influence of time on price and also the influence of price on Time. eg. a price hi of 50 generates time cycles of 50.
He saw that time and price were independent forces and he also saw that there was a relationship between them.
Just like Hurst could not explain the "Why" of the oscillatory nature of price movement, Gann did not explain it either . ( thou I do have a bullet point list,maybe written by Billy jones, which says the fundamental vibratory force is spirit).
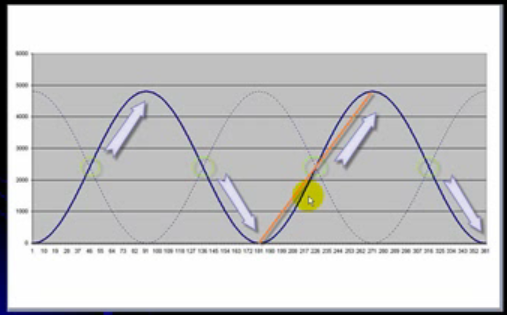
I'm pondering why a range chart with price units on the x-axis (time) , could possibly show an oscillatory structure ?
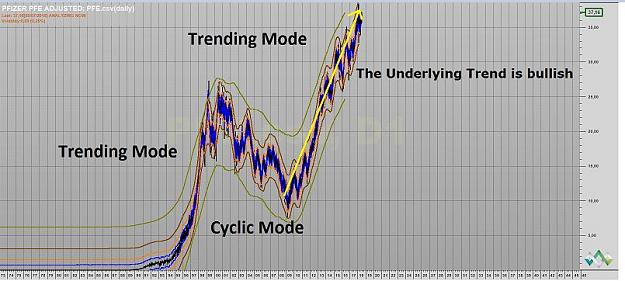
In watching the mkts , I often find that the range charts take on these channel structures when the mkt has spike moves.
Its' as if price takes control of the mkt.. ? ( sounds weird, I know ...but its as if it is price movement itself that is generating both the supply and demand)
how is it possible for the range chart to show an oscillatory structure.?? ( This time it is a constant t/line channel structure.. Other times it can be a dynamic cycle structure ). (I use bollinger bands, because they r part of my chart package, and I like the volatility component.... )
My understanding of Gann is that he explored the influence of time on price and also the influence of price on Time. eg. a price hi of 50 generates time cycles of 50.
He saw that time and price were independent forces and he also saw that there was a relationship between them.
Just like Hurst could not explain the "Why" of the oscillatory nature of price movement, Gann did not explain it either . ( thou I do have a bullet point list,maybe written by Billy jones, which says the fundamental vibratory force is spirit).
I'm pondering why a range chart with price units on the x-axis (time) , could possibly show an oscillatory structure ?
In watching the mkts , I often find that the range charts take on these channel structures when the mkt has spike moves.
Its' as if price takes control of the mkt.. ? ( sounds weird, I know ...but its as if it is price movement itself that is generating both the supply and demand)
how is it possible for the range chart to show an oscillatory structure.?? ( This time it is a constant t/line channel structure.. Other times it can be a dynamic cycle structure ). (I use bollinger bands, because they r part of my chart package, and I like the volatility component.... )