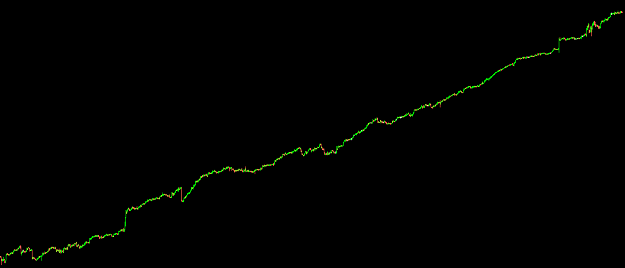
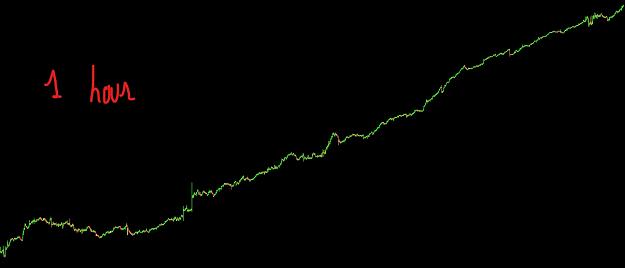
In this post i'll show you a fact. This is what happens if you take all the 0 hour bars H1 and you "glue" them (taken from metaquotes demo server (GMT 0), maybe it could vary for other brokers). For every bar is one day, and youll see how strange thing have worked for the ~1300 last days straight in EURUSD... Of course this is not tradable due to high spreads and slipage during this hour
In this post i'll show you a fact. This is what happens if you take all the 0 hour bars H1 and you "glue" them (taken from metaquotes demo server (GMT 0), maybe it could vary for other brokers). For every bar is one day, and youll see how strange thing have worked for the ~1300 last days straight in EURUSD... Of course this is not tradable due to high spreads and slipage during this hour {image}
Ignored
So we have more UP bars at 0 hours compare to DN Bars. Did i get it correct ?
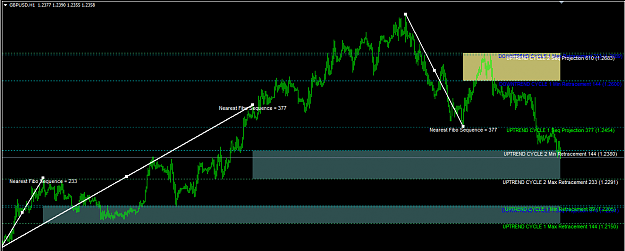
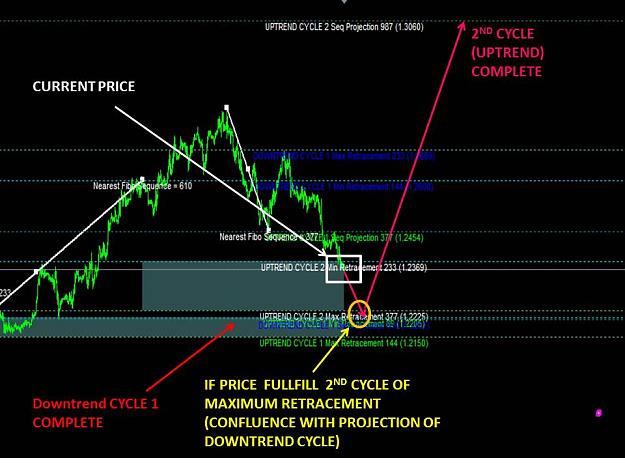
Fibonacci Sequence ..any idea to calculate probability..probability to hit minimum retracement and maximum retracement. Right now GU H1 already hit Projection of Cycle 1 ( 337 pips more or less) and did not hit min and max retrace yet... then make another 334 pips before hit point of retrace (minimum retrace) of 2nd Cycle. Next move is? continue to maximum retrace of Cycle 2 (140 pips) or Just stop there and continue to the projection of CYCLE 2?
In this post i'll show you a fact. This is what happens if you take all the 0 hour bars H1 and you "glue" them (taken from metaquotes demo server (GMT 0), maybe it could vary for other brokers). For every bar is one day, and youll see how strange thing have worked for the ~1300 last days straight in EURUSD... Of course this is not tradable due to high spreads and slipage during this hour {image}
Ignored
This is interesting. Have you tried applying this to other hours for other pairs? I'm unable to get the same bullish bias with my own tabulated occurrences though (For both demo and live). Are you essentially suggesting that at Tokyo Open, there is a bullish bias for 1 hour for the past x days?
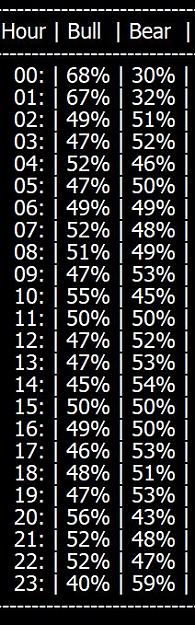
This is EURUSD (GMT+2 broker) from a live chart for the last 317 days. It plots the number of bull & bear candles for each hour.
You can see that for hours 0 and 1, there seems to be a bullish bias for the past 317 days (Not in the hour that you stated, however)
This doesn't actually mean you would be profitable 68% of the time if you were to buy whenever the candle opens, because the average HL range is < 10 pips. Including commissions & spread, just buying blindly and closing at the end of the candle will not give you positive expectancy.
{quote} This is interesting. Have you tried applying this to other hours for other pairs? I'm unable to get the same bullish bias with my own tabulated occurrences though (For both demo and live). Are you essentially suggesting that at Tokyo Open, there is a bullish bias for 1 hour for the past x days? This is EURUSD (GMT+2 broker) from a live chart for the last 317 days. It plots the number of bull & bear candles for each hour. You can see that for hours 0 and 1, there seems to be a bullish bias for the past 317 days (Not in the hour that you stated,...
Ignored
I have created candles. Quants renko realistic online long time ago.
It will draw Candle at the candle close. So if you attach on 1hr chart and input 1000 points. It will generate from Start date renko charts whenever candle closed > 100 pips.
So there can be some candles higher than 100 but it will be atleast 100 most of the time.
However with this candles you can attempt to get the probability of next bar. Then it will give some results and then you can know that it will close At X pips.
I think color pattern is one of the tricks.
Like after 3 green's what is the probability 4th will be green.
I have designed permutations and auto pattern search algorithm using KMP. It have found up to 7-8 length patterns repeated in history and their win rate like %100 but they pop up 3 times only. I have lost the code unfortunately and since then i havent put my hands on it.
But i have new idea and my unnique idea is gonna be, We can check current market situation, Find that in the past. So whenever new bar is created we will compare current situation in the past and get the answer.
So , We can see most current 7 bars. or 6 Bars.
Find that combination in the past. And get the probability.
So if the pattern found check the next candle, Save the result then keep searching the same pattern again. Then it will let us know the result and there always will be a signal as we are checking current market.
It will develop unique patterns as well.
Start Date is important because it will make sure you are generating same renko chart over again.
Fibonacci Sequence ..any idea to calculate probability..probability to hit minimum retracement and maximum retracement. Right now GU H1 already hit Projection of Cycle 1 ( 337 pips more or less) and did not hit min and max retrace yet... then make another 334 pips before hit point of retrace (minimum retrace) of 2nd Cycle. Next move is? continue to maximum retrace of Cycle 2 (140 pips) or Just stop there and continue to the projection of CYCLE 2? related to this topic? {image}
Ignored
Not sure if i understood that clearly , please elaborate in simple terms and rules. What we have to find exactly
Guys, the chart i posted before doesn't say that we have more up bars than down (that it's very possible), it says that the mathematical expectation is positive (and also that it is very consistent in time). You could have a strategy with 1 pip of take profit and 100 pips stop loss and probabilities would be on your side but the mathematical expectation wouldn't be so good. You have to care that the mathematical expectancy is in your favor, otherwise beautiful probabilities numbers are not going to help, you have to take in consideration how much you win when you win and how much you lose when you lose.
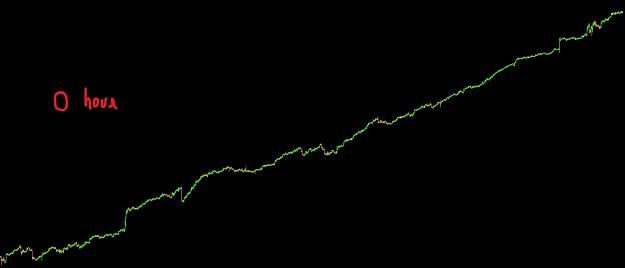
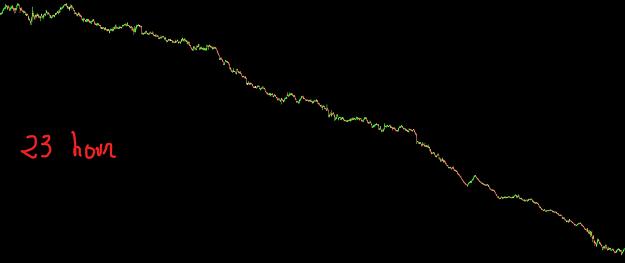
Carddard, yes, I tried with other hours and your statistics are very similar to what i have seen, i think the hours matches despite the GMT. There has been an edge in the hours you said and also the 23 one, but like you said i think it is not tradable (around the 0 hour there are very good oportunities almost always to trade triangular arbitrage, free-risk money, for the few ones who have the luck to trade that, so they are very active around this hours and the lack of liquidity make that hours very difficult to trade for us). These are the charts (0, 1 and 23 hour):
{quote} I have created candles. Quants renko realistic online long time ago. It will draw Candle at the candle close. So if you attach on 1hr chart and input 1000 points. It will generate from Start date renko charts whenever candle closed > 100 pips. So there can be some candles higher than 100 but it will be atleast 100 most of the time. However with this candles you can attempt to get the probability of next bar. Then it will give some results and then you can know that it will close At X pips. I think color pattern is one of the tricks. Like...
Ignored
Renko bars are a possible solution to the problem of atr/spread but you have to think that you loose a very important component in forex, time. Time has the same importance that price, and what you are doing is closing one eye basically. Renko are much better that japanese candles in finding important levels, but i think you should open the closed eye and see the not time-distorted graph also.
Edit: I have to say that the indicator you post looks very good, since you keep the notion of time, not like the usual renko bar chart
Guys, the chart i posted before doesn't say that we have more up bars than down (that it's very possible), it says that the mathematical expectation is positive (and also that it is very consistent in time). You could have a strategy with 1 pip of take profit and 100 pips stop loss and probabilities would be on your side but the mathematical expectation wouldn't be so good. You have to care that the mathematical expectancy is in your favor, otherwise beautiful probabilities numbers are not going to help, you have to take in consideration how much...
Ignored
Thanks for elaborating, really appreciate it.
Help us laymen out a little, I don't quite understand what you've mentioned regarding mathematical expectation and what it really means from a price movement standpoint. Please pardon my ignorance, it may be my lack of in-depth understanding of probabilities. Would appreciate it if you could share more - I understand mathematical expectation as an indicator of an occurrence of an event.
A mathematical expectation of 0 = no occurrence of the said event
A mathematical expectation of > 0 = there is an occurrence of the said event
How does that apply to the 3 charts that you have shared? Would an upwards moving curve imply an expected value of > 0, and a downward moving curve implying an expected value of 0? And what is the event that is occurring here?
I have created candles. Quants renko realistic online long time ago.
It will draw Candle at the candle close. So if you attach on 1hr chart and input 1000 points. It will generate from Start date renko charts whenever candle closed > 100 pips.
So there can be some candles higher than 100 but it will be atleast 100 most of the time.
However with this candles you can attempt to get the probability of next bar. Then it will give some results and then you can know that it will close At X pips.
I think color pattern is one of the tricks.
Like after...
Have you done any work on pivot point probabilities? (Not so much on what we already know regarding pivot points being reached, but rather the directional bias that continues upon the touch of a pivot point within any given trading day)
{quote} I have created candles. Quants renko realistic online long time ago. It will draw Candle at the candle close. So if you attach on 1hr chart and input 1000 points. It will generate from Start date renko charts whenever candle closed > 100 pips. So there can be some candles higher than 100 but it will be atleast 100 most of the time. However with this candles you can attempt to get the probability of next bar. Then it will give some results and then you can know that it will close At X pips. I think color pattern is one of the tricks. Like...
Ignored
According to the fibonacci sequence, prices move in sequence to fullfil the cycle. from my overservation there will be 2 cycles in every time frame before reversal and in every cycle there will be 1 or 2 retracements ( min or max). After complete cycle 1, price will continue the trend before making retracement (min or max) for 2nd cycle before complete the 2nd cycle. based on the picture GU H1 (UPTREND) 1st and 2nd cycle already complete . The blue Sequence is another cycle of DOWNTREND after the completing of the 2nd CYCLE.
There are several confluences
1. Point of projection of 2nd Cycle (UPTREND) confluence with the maximum retracement of DOWNTREND
2. Projection of the DOWNTREND Cycle confluence with MINIMUM RETRACEMENT of 1st CYCLE
3. PRICE right now at the point of MINIMUM RETRACEMENT OF 2nd CYCLE
The interesting points here are
A. The MIN MAX RETRACMENT of 2nd CYCLE never occurs before Projection. Mostly there is min or max retrace before cycle complete but in this case 2nd Cycle complete without retracement.
B. The DOWNTREND sequence is in doing its 1st cycle and already hit the max retracement (same as projection of 2nd cycle) and NOW at the point of MINIMUM RETRACE OF 2nd CYCLE which is never be hitted before (refer point A)
if The Price want to full fill MIN/MAX RETRACEMENT of 2nd CYCLE- which means that the projection of the DOWNTREN CYCLE will not be fullfilled as this price movement is for 2nd CYCLE
OR
There is no min/max retrace of 2nd Cycle and the price movement is for DOWNTREND Cycle and the projection will be fullfiled which is confluence with MIN Retracement of 1st CYCLE ( which already hit before)
Where the price will go? price move for 2nd cycle of DOWNTREND? or to Fullfiled the max retracement of 2nd cycle (UPTREND) and then create another UPTREND CYCLE?
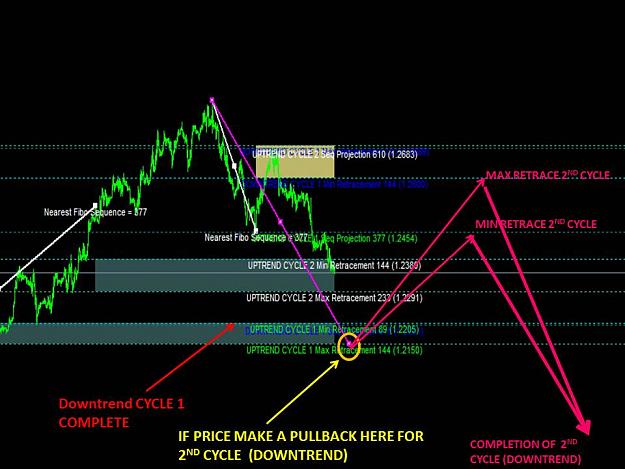
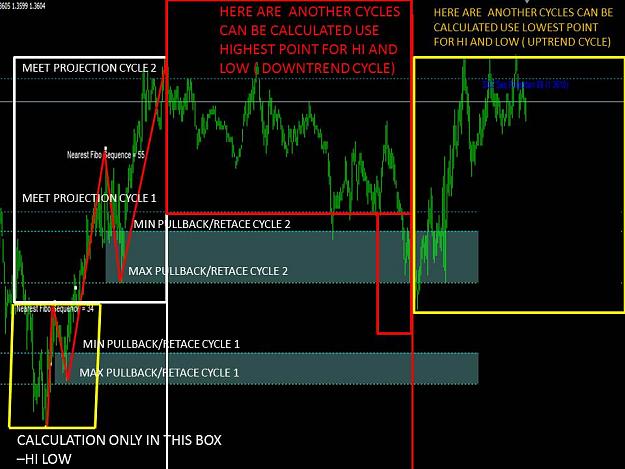
2ND picture just a thought for 2nd Cycle of Downtrend. The Min and Max can only be calculated after the 1st pullback occurs after the completion of the EACH Cycle. (real time)
3RD picture just a thought for the 2nd Cycle (Uptrend) to complete
Actually my post refer to your previous thread after you move to this thread. to find probability of the price movement
{quote} Thanks for elaborating, really appreciate it. Help us laymen out a little, I don't quite understand what you've mentioned regarding mathematical expectation and what it really means from a price movement standpoint. Please pardon my ignorance, it may be my lack of in-depth understanding of probabilities. Would appreciate it if you could share more - I understand mathematical expectation as an indicator of an occurrence of an event. A mathematical expectation of 0 = no occurrence of the said event A mathematical expectation of > 0 = there...
Ignored
I think we are thinking in different things regarding mathematical expectation. Ok, so applying to this context of trying to get an edge from one hour in a day we have 4 things to look:
1.- P1 = Probability of this hour closing above the open (or equal) (between 0 and 1)
2.- P2 = Probability of this hour closing below the open (between 0 and 1)
3.- X1 = Average (close - open) when this hour closing above the open (or equal) (this is >= 0)
4.- X2 = Average (close - open) when this hour closing below the open (this is < 0)
In this case P1 + P2 = 1 but in other cases you could have more P's ans X's
So the mathematical expectation is: P1 * X1 + P2 * X2
If this value is > 0 is a good signal.
In the charts i posted earlier the 0 and 1 hour have a clearly > 0 expected value and the 23 hour < 0.
But one thing very important also is the CONSISTENCY in the last ~1300 days, and that means that if you divide in intervals this 1300 days (for example the half of it, two intervals of 650 days), the majority of them will have a expected value > 0 (the first 650 interval clearly has E.V. > 0 and the second also).
{quote} Thanks for elaborating, really appreciate it. Help us laymen out a little, I don't quite understand what you've mentioned regarding mathematical expectation and what it really means from a price movement standpoint. Please pardon my ignorance, it may be my lack of in-depth understanding of probabilities. Would appreciate it if you could share more - I understand mathematical expectation as an indicator of an occurrence of an event. A mathematical expectation of 0 = no occurrence of the said event A mathematical expectation of > 0 = there...
Ignored
The expectancy is calculate as (Win % x Average Win Size) – (Loss % x Average Loss Size)
Input the percentages as a decimal. For example, 80% is 0.8.
So to have a system with positive expectancy you need (win% x average win size) > (loss% x average loss size).
{quote} I have created candles. Quants renko realistic online long time ago. It will draw Candle at the candle close. So if you attach on 1hr chart and input 1000 points. It will generate from Start date renko charts whenever candle closed > 100 pips. So there can be some candles higher than 100 but it will be atleast 100 most of the time. However with this candles you can attempt to get the probability of next bar. Then it will give some results and then you can know that it will close At X pips. I think color pattern is one of the tricks. Like...
Ignored
Hi,
In answer on your idea for looking for patterns in bar sequences.
In your proposal for instance 100 pips bars.
In 2012/2013 there was a similar thread with similar idea.
Named Fractals, ZZ and the Pissing Dog.
Instead of 100 pip bars normal M5/M15 bars where used over a couple of years.
This resulted in a very long string of ones and zeroes, one = up bar, zero = down bar.
Next the occurrences of substrings of length 4 until 13 where calculated/counted.
So for a substring of 4 bars we have 16 different combinations from 0000 upto 1111.
For a substring of 5 bars we have 32 combinations and so on.
This information was saved in a database, so not that easy for MT4/MT5.
After every closed bar, you take the last 3 bars and calculate the probability for next bar is
1(up) or 0(down) based on the 4 bar substring.
This you also do for the last 4 bars based on substrings of 5 bars.
The last calculation is based on the last 12 bars based on substrings of 13 bars.
Now you have 10 probabilities and you can calculate the overall probability.
The above mentioned thread went further by also calculating Fractals and Zigzag turning points.
These both also give sequences of zeroes and ones.
The idea was to predict the zigzag turning points.
The people who found this a good strategy/approach and had enough coding skills spent hundreds
of hours in this strategy.
Including myself. The thread died in beauty.
OK, you go for bars of xx pips, this is different. But it also means that you will have a
limited string of zeroes and ones. Which means that occurrences are low.
Using pip bars also implicates that in a trending market substrings with clearly more zeroes or ones
will preveal. In a ranging market it will be more equally.
For me not sure if in this you can use the simple statistics.
Ok, this are my thoughts.
BR
It is not important how often you fall down, but how often you get up again
{quote} Hi, In answer on your idea for looking for patterns in bar sequences. In your proposal for instance 100 pips bars. In 2012/2013 there was a similar thread with similar idea. Named Fractals, ZZ and the Pissing Dog. Instead of 100 pip bars normal M5/M15 bars where used over a couple of years. This resulted in a very long string of ones and zeroes, one = up bar, zero = down bar. Next the occurrences of substrings of length 4 until 13 where calculated/counted. So for a substring of 4 bars we have 16 different combinations from 0000 upto 1111....
Ignored
HI emonts,
just an idea, try to use sequence number for calculation next move of the candles. there should be 2 pullback and 1 projection.
the seq number is a number added from previous number starting from 0 and 1
0,1,1,2,3,5,8,13,21,34,55,89,144,233,377
calculation for every candle can be made using small number
for example:
if you choose 13...number 8 and 5 become pullback/retrace and number 21 become next projection. (1st cycle)
next
if price breaks projection number 21 next number will be 34 or 55
if price stop at 55 and do pullback/retrace 34 and 21 is a point for max and min pullback/retrace and the projection will be 89
if the calculation is right we can get a good zig zag turning point and projection
i dont know how to calculate based on number of candles ...just an idea and i did it based on hi low. refer below pictures..the red zig zang is the price movement after calculation have been made using 1st hi low of the lowest point on that chart. i can do at every time frame and get a similar result as long as the point of hi low is correct
I know its a long shot but is there any chance that this suggestion can be transferred to an indicator:
If we take in consideration user entry Alligator and pSAR settings and pSAR crosses in the same direction as Alligator is trending what is the probability that price will:
- hit SL (1R= X * ATR value) before hitting TP 2R - hit TP 2R before SL - hit TP 3R before SL - hit TP 4R before SL - hit TP 5R before SL
{quote} This is interesting. Have you tried applying this to other hours for other pairs? I'm unable to get the same bullish bias with my own tabulated occurrences though (For both demo and live). Are you essentially suggesting that at Tokyo Open, there is a bullish bias for 1 hour for the past x days? This is EURUSD (GMT+2 broker) from a live chart for the last 317 days. It plots the number of bull & bear candles for each hour. You can see that for hours 0 and 1, there seems to be a bullish bias for the past 317 days (Not in the hour that you stated,...
Ignored
Hi
Can you atach the indi you are using ?Cant find it anywhere. Or point me where i can get it?
thanks in advancce