If you are tracking the GBPUSD market this week, consider this top-down technical perspective from a swing trader.
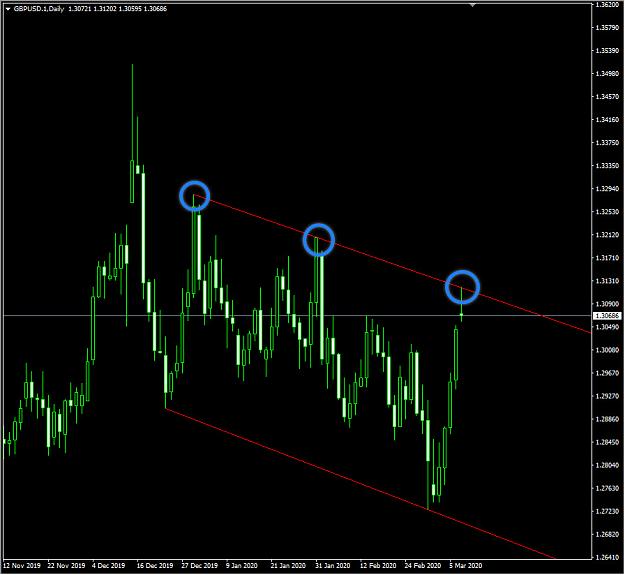
Recent daily price action has moved towards the resistance trendline of a falling wedge (red) traceable to December 31, 2019. It is also located near the 1.31040 horizontal resistance. Technically, we may see a sideways of price action in the early part of this week, but we should not be surprised if bulls take it to the 1.31740 horizontal resistance area, which is the immediate technical target.
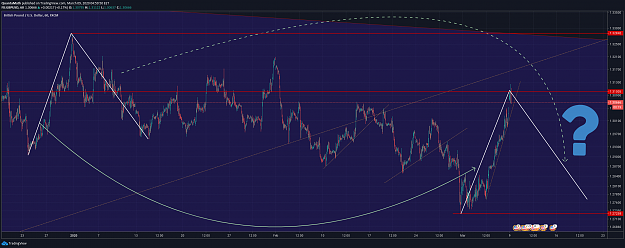
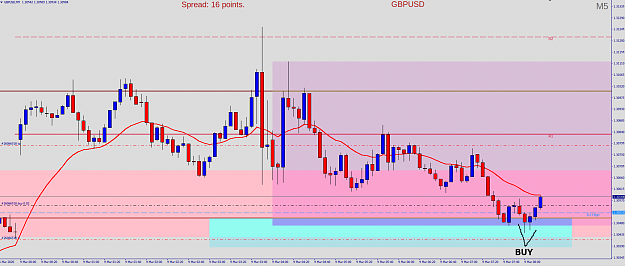
Price action on the H4 time frame is presently bullish. However, it is just about 50 pips to the next horizontal resistance around 1.31040 area and we may see a sideways of price action. It has to break above the area before we can have confidence in any bullish drive.
I may be wrong. Trade safe and prosper.
KP
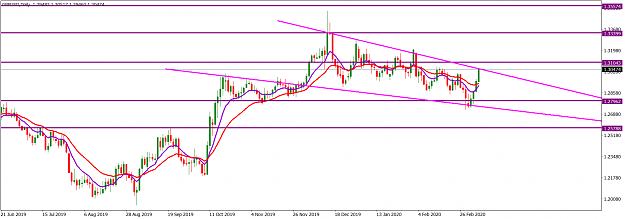
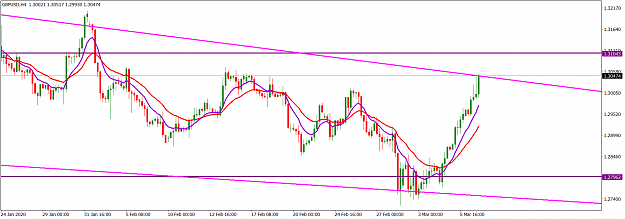
Recent daily price action has moved towards the resistance trendline of a falling wedge (red) traceable to December 31, 2019. It is also located near the 1.31040 horizontal resistance. Technically, we may see a sideways of price action in the early part of this week, but we should not be surprised if bulls take it to the 1.31740 horizontal resistance area, which is the immediate technical target.
Price action on the H4 time frame is presently bullish. However, it is just about 50 pips to the next horizontal resistance around 1.31040 area and we may see a sideways of price action. It has to break above the area before we can have confidence in any bullish drive.
I may be wrong. Trade safe and prosper.
KP
Attached Image (click to enlarge)
Attached Image (click to enlarge)
Do your homework, follow the footprints of smart money