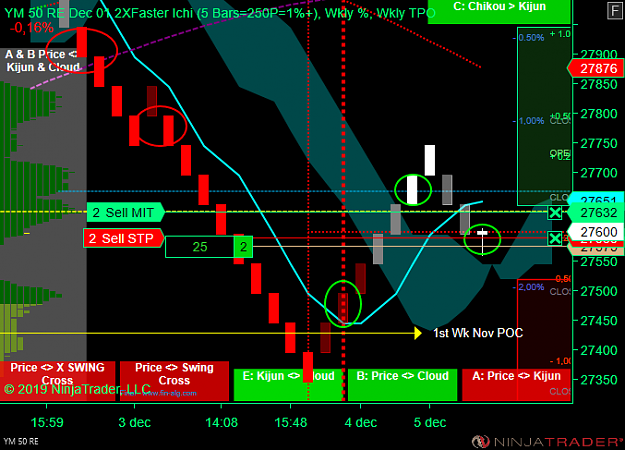
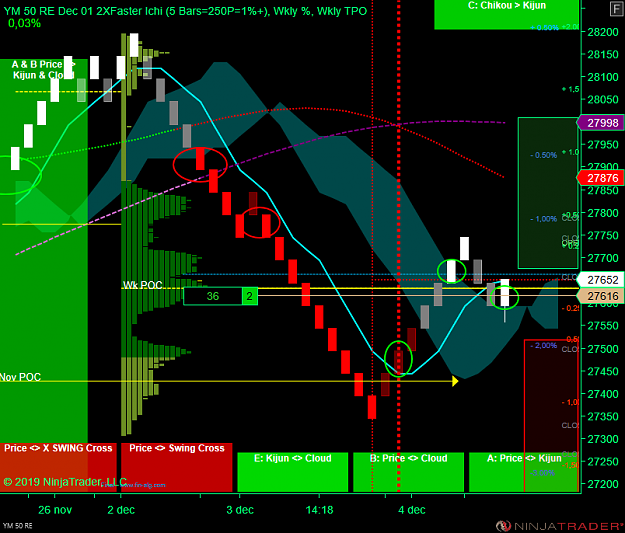
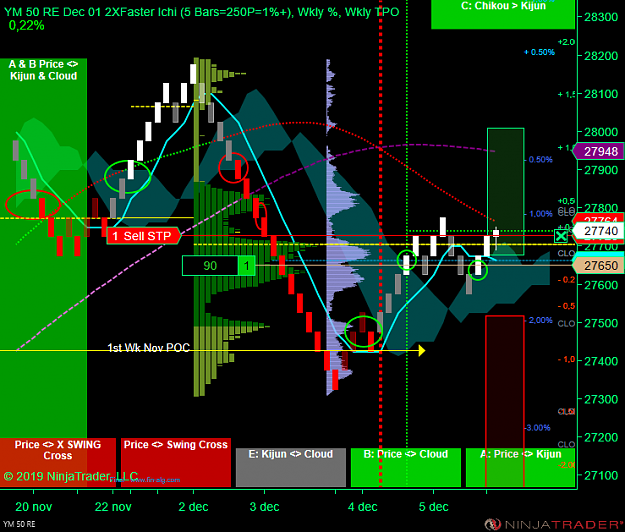
DOW price needs to get above the Weekly POC @ 650 zone and remain above the Ichi cloud.
But still Bearish longer term, because the price is below my Swing MA line channel.
So scalping up & down bewteen the Swing MAs and Ichi cloud.
Swing long above the channel @ 27.950<>28.000 (if we ever get there again)
Swing short below 27.500 below the Ichi cloud. Price is already below the Swing MA channel as said.
Just see where the momentum/break out takes place.
Nov 24/25. Price above the Ichi cloud and Swing MA line. SWING LONG
Dec 2/3. Price below the Ichi cloud and Swing MA lines. SWING SHORT.
Today bewteen all the lines and Ichi cloud. Just light scalp trading
Attached Image (click to enlarge)
It's better to be out wishing to be in... than to be in wishing to be out!
DOW price needs to get above the Weekly POC @ 650 zone and remain above the Ichi cloud. But still Bearish below my Swing MA line channel So scalping up & down bewteen the Swing MAs and Ichi cloud. Swing long above the channel @ 27.950<>28.000 (if we ever get there again) Swing short below 28.500 below the Ichi cloud. Price is already below the Swing MA channel as said. {image}
Ignored
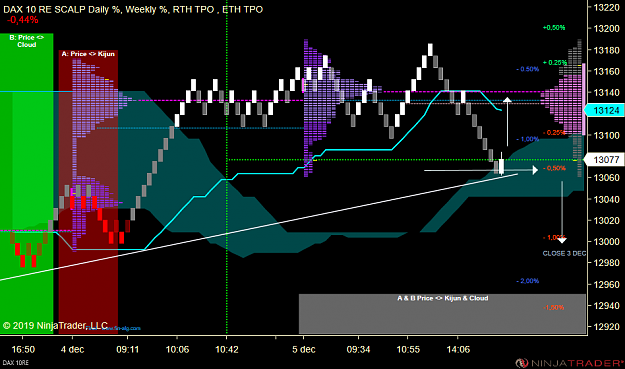
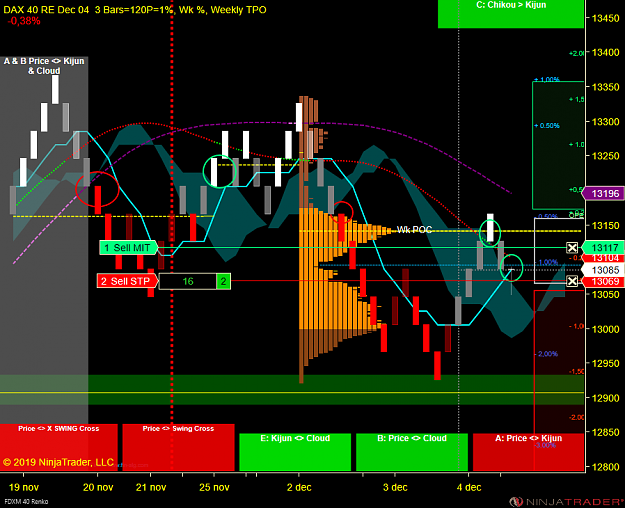
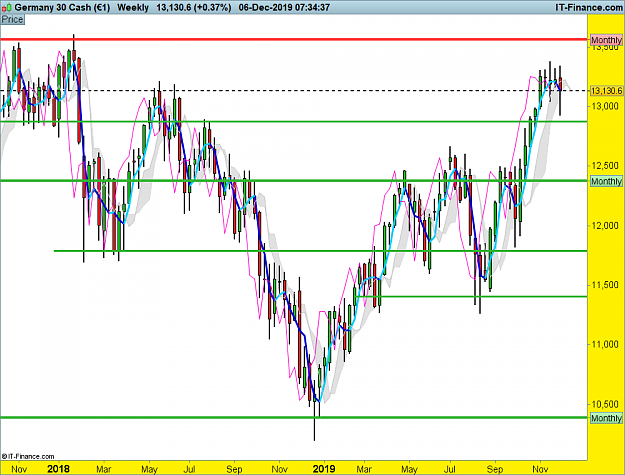
Exact same story for the DAX
Swing long above 13.150<>13.200 Price above the Ichi cloud and Swing MA line.
Swing short below 13.050<>13.000 Price below the Ichi cloud and Swing MA lines
Attached Image (click to enlarge)
It's better to be out wishing to be in... than to be in wishing to be out!
DOW price needs to get above the Weekly POC @ 650 zone and remain above the Ichi cloud. But still Bearish below my Swing MA line channel So scalping up & down bewteen the Swing MAs and Ichi cloud. Swing long above the channel @ 27.950<>28.000 (if we ever get there again) Swing short below 28.500 below the Ichi cloud. Price is already below the Swing MA channel as said. Just see where the momentum/break out takes place. Nov 24/25. Price above the Ichi cloud and Swing MA line. LONG Dec 2/3. Price below the Ichi cloud and Swing MA lines. SHORT. Today...
DOW price needs to get above the Weekly POC @ 650 zone and remain above the Ichi cloud. But still Bearish longer term, because the price is below my Swing MA line channel. So scalping up & down bewteen the Swing MAs and Ichi cloud. Swing long above the channel @ 27.950<>28.000 (if we ever get there again) Swing short below 27.500 below the Ichi cloud. Price is already below the Swing MA channel as said. Just see where the momentum/break out takes place. Nov 24/25. Price above the Ichi cloud and Swing MA line. SWING LONG Dec 2/3. Price below the...
Ignored
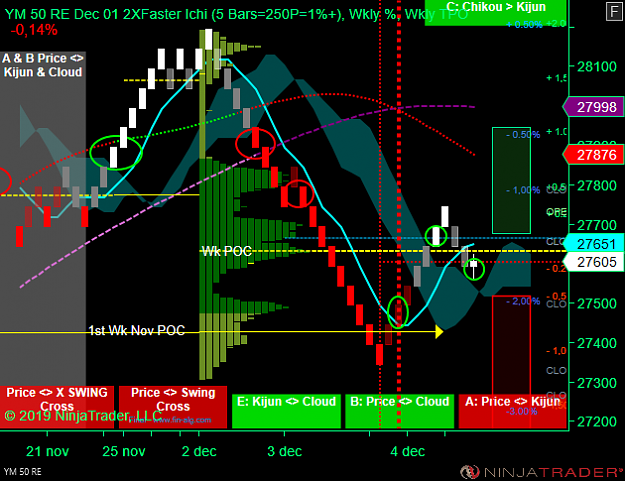
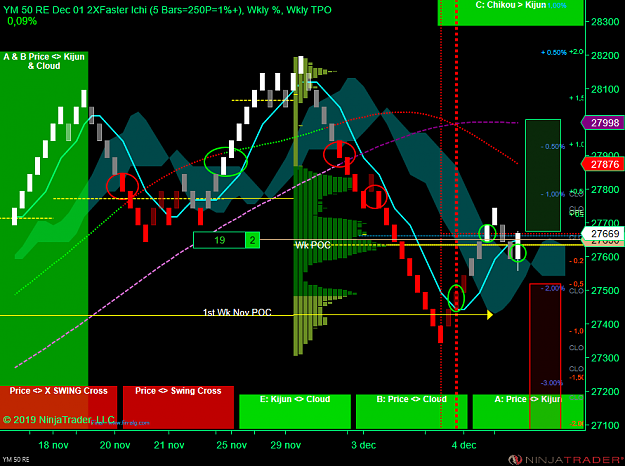
Tested the cloud and tries to move North. Above 700 maybe little more momentum
Price above the Wk POC now. Back @ Y close. Stalling there.
T1 & T2 reached
2 runners overnight.
Poss. trgt 800<>900 between my Swing MA lines/Swing line channel
Attached Image (click to enlarge)
It's better to be out wishing to be in... than to be in wishing to be out!
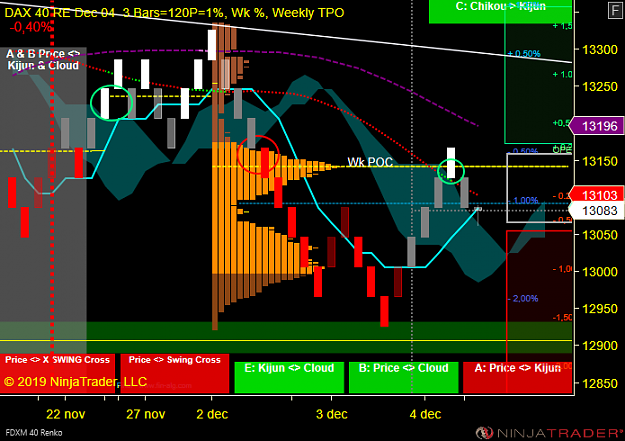
DAX L @ 13.069 Poss trgt 13.140<>13.150 W POC (in the middle of my Sw MA channel) T1 & T2 reached 2 runners maybe overnight. Still scalping zone. Below my Swing MA line, but above the Ichi cloud. Above the W POC/13.150 maybe more momentum up {image}
Ignored
Yes, more or less the middle of big fall started last monday 13335>12920, 50%=13135
Hi Dutchy,
Thanks for the detailed posts. Your posts have guided me to use the weekly market profile to search for POC, single prints etc. What also helps me is to use a custom volume profile with action from past couple of days to one week. I draw it to include days where price was near today's level. I look in it for high volume nodes and pockets. Price always seems to want to go and test these areas.
If you don't mind could you describe the last thing that "trigger" your entry? Because with so big bricks renko charts you entry I feel will have some fine tuning to get it right. Also if I remember correctly your SL is at the other side of the cloud (or the middle of it).
{quote} I'm (counter) long in the DOW E Mini Futs @ 425/just above the 1st Wk November Weekly POC @ 400 zone . Bounced from there (so far). Took profit @ T1 & T2. T3 +210p 1 lot left running/+100p locked in +150p locked in FLAT +150p last lot Free ride to the upside. Maybe 650/750 zone/November Monthly POC zone. Daily RTH GAP up to fill to Dec 2 low/750 zone. (27.500 is the road block/Res, level now) From last Wk high/28.200 to this Wk low approx 900p drop. A 50% recovery should be at 27.750/800 zone, which is this Wk Dev POC @ 27.800 If the 27.500...
Ignored
Re the DAX, going back to the swing high in Jan 2018 before that massive move down, this is the second time it's been re tested on the weekly but this time it's higher than the previous test in May 2018, from here I think it could go higher to just above the main high in Jan 2018 or from where it's currently at, drop hard. I don't normally do longer term positions like that but that's my overall projections and trade intraday accordingly.
Hi Dutchy, Thanks for the detailed posts. Your posts have guided me to use the weekly market profile to search for POC, single prints etc. What also helps me is to use a custom volume profile with action from past couple of days to one week. I draw it to include days where price was near today's level. I look in it for high volume nodes and pockets. Price always seems to want to go and test these areas. If you don't mind could you describe the last thing that "trigger" your entry? Because with so big bricks renko charts you entry I feel will have...
Ignored
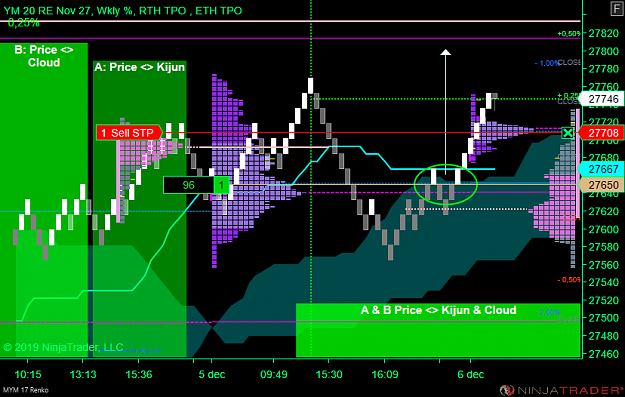
Hi Siju,
The answer of your last question is in the screen shots in above post.
The big Renko brick chart shows me the longer trend or flow of the market and where the price is in relation to my Swing MA lines.
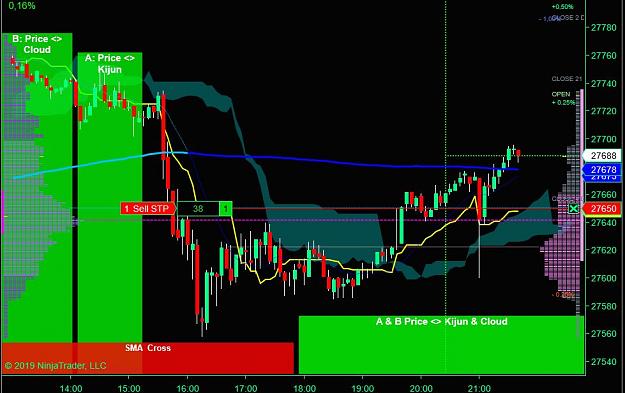
As explained some posts back, the price is now between my Bearish Swing lines (bearsish maket for me) but the price wants to jump above the Ichi cloud. That means scalping between the Bearish Swing lines and the little Bullish PA action above the faster responsive Ichi cloud.
To find an (scalp) entry I break the Renko chart down to a smaller brick size, like the RE 10 or RE 20. Or sometimes a fast Minute chart as you can see in post 4934 above.
I prefer to watch Renko charts only. Renko 50 to Renko 100 for the Daily/Weekly flow/direction/trend. Whatever you call it.
For entries I prefer the Renko 10 to 20.
But:
I want to see the same entry point/decision point at the SAME place on both brick size charts.
That means that whatever Renko brick size chart I use/watch, the Ichi indicator (and other indicators) has/have to show the same level.
I want to see the price leaving/breaking out of the Ichi cloud at the same time and same place on both Renko charts.
That means very different Ichomoku settings on lets say Renko 50 and Renko 10 or Renko 20 charts.
Both different brick sized charts tell me the same story/indicator levels in this way. No confusion when one brick size chart tells me this and the other brick size chart tells me that.
You can do the same thing with Minute charts. Let your MA lines show the same levels on both different Minute charts.
Lets say a 180 M chart for the flow/trend and a 15 M or 30 M for the (scalp) entries.
PS
I added the Volume profile on the chart as well.
Looks very simular to the TPO profile, but its not always like this.
TPO profile shows the POC/VAH/VAL/single TPOs etc. which you can't see on the Volume profile.
Attached Image(s) (click to enlarge)
It's better to be out wishing to be in... than to be in wishing to be out!
Markets break out to the North. X Mass rally seems to start. Many traders still hope anyway.
But DOW and DAX prices are still between my Bearish Swing channel MA lines. Prices need to break out above their channels for Bullish confirmation. (my strategy anyway)
DOW trgt 27.800<>900 zone
It's better to be out wishing to be in... than to be in wishing to be out!
{quote} Re the DAX, going back to the swing high in Jan 2018 before that massive move down, this is the second time it's been re tested on the weekly but this time it's higher than the previous test in May 2018, from here I think it could go higher to just above the main high in Jan 2018 or from where it's currently at, drop hard. I don't normally do longer term positions like that but that's my overall projections and trade intraday accordingly.
Ignored
Very good observation!
On Bloomberg many analists/guru's predict new record highs for EU stocks next year. Could even out perform US stocks.
I follow my charts/MA lines. Lets see where it will go to.
Long term trades are difficult now with an US president who can change his mind on all running issues during the weekend. Depends on his mood or so.
Attached Image (click to enlarge)
It's better to be out wishing to be in... than to be in wishing to be out!