Disliked{quote} Yes I get it, we are on the same page. Maybe my usage of the term "Dynamic Basketting" threw you. A few quick questions though: For every time your Index gives a signal, do you have to "re-determine" which Group A and Group B baskets to trade (Dynamic Basketting)? Or... Are your Group A and Group B baskets always fixed based on your chosen Index (Fixed Basketting: like we currently have with the C,5,12,14,etc)? How do you decide which pairs goes into the groups based on your chosen Index? Is there a "formula" applied to determine this or...Ignored
QuoteDislikedYes I get it, we are on the same page.
And your questions are perfect and to the point...
QuoteDislikedFor every time your Index gives a signal, do you have to "re-determine" which Group A and Group B baskets to trade (Dynamic Basketting)? Or... Are your Group A and Group B baskets always fixed based on your chosen Index (Fixed Basketting: like we currently have with the C,5,12,14,etc)?
QuoteDislikedHow do you decide which pairs goes into the groups based on your chosen Index? Is there a "formula" applied to determine this or is it based solely on the historical correlation/decorrelation of each pair when compared with the Index of choice?
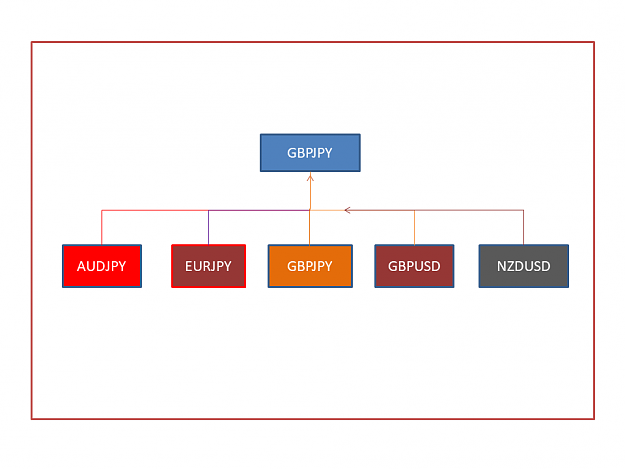
I modified the BasketChart2 indicator again -- the one that @LifeHunt3r recently shared. It's a great indicator and gave me some ideas. The new indicator is called R4M-BasketProfitLossEstimator. What it allows me to do is to estimate the P/L for each pair based on the chosen index. When the Smoothed HA signals a transition then we save the Open price for the current symbol and with each subsequent bar we compute the delta (i.e. difference) between the open price and the current close price. If the current trend is BULLISH and the symbol belongs in Group A then: Delta = Close - Open, or if the symbol belongs in Group B then: Delta = Open - Close. And we keep summing and plotting all the deltas until we reach the next transition. If the current trend is BEARISH then we adjust the computations accordingly. In the end you get a P/L chart that makes it very clear whether a symbol should be traded with the Smooth HA's trend or opposite the trend. And this then allows you to assign the symbol to either Group A or Group B. Also, depending on the total P/L you may decide that a symbol makes minimal contribution and, so, you ignore it. So, given a particular index, I'll test all 28 pairs and maybe I'll choose 11-15 with the highest P/L's and assign them to Group A or Group B.
Keep in mind the R4M-BasketProfitLossEstimator indicator does not really trade -- there are no StopLosses so it never loses. It only compares the open price at a signal with subsequent close prices (until the next signal). It roughly simulates trading from signal-to-signal. The Group A and Group B assignments that I've been able to compose using this indicator align with current 'C' and 'RB' baskets, so I'm pretty sure it is working correctly. But since it is hot-off-press then I'm not yet prepared to guarantee that it is working perfectly.
4