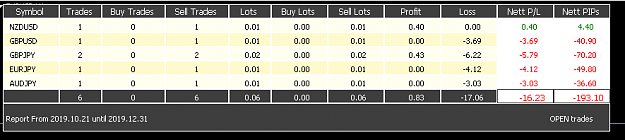
Disliked{quote} Yes aaven! I wish I could lol! But the "greedy" part of me is FOCUSED more on HOW we can further maximize the "turn-around" points between Buy/Sell baskets - I've always felt that we leave TOO MUCH money on the table every time we go from a Buy basket to a Sell basket and vice versa. I TRY to minimize those pips by using tighter SLs towards what I perceive to be the "end" phases of the baskets. Anyways, just in case anyone here has any ideas which may help, PLEASE feel free to share. Regards and Stay fluid, TyIgnored
QuoteDislikedBut the "greedy" part of me is FOCUSED more on HOW we can further maximize the "turn-around" points between Buy/Sell baskets - I've always felt that we leave TOO MUCH money on the table every time we go from a Buy basket to a Sell basket and vice versa.
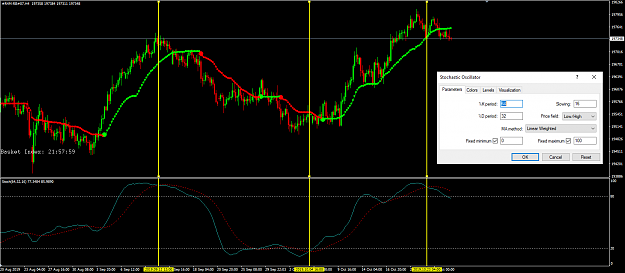
@TyLamai -- I'm still experimenting but the Stochastic oscillator -- as a momentum indicator -- may offer some relief. I've attached a chart below that shows when the Main line (blue) crosses the Signal line (dashed red) it often does a pretty good job of detecting the transition from one trend to the next. You also have the Overbought (level 80) and Oversold (level 20) lines to provide additional context.
Attached Image (click to enlarge)
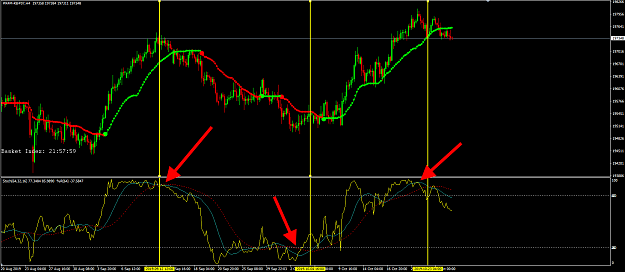
And below I've added the Williams oscillator (using a period of 64) in yellow. The Williams is a bit faster than the Stochastic's Main line, but when Williams crosses BOTH the Stochastic's Main and Signal lines either in the Overbought or Oversold regions then that might be a clue the wind is changing direction.
Attached Image (click to enlarge)
3