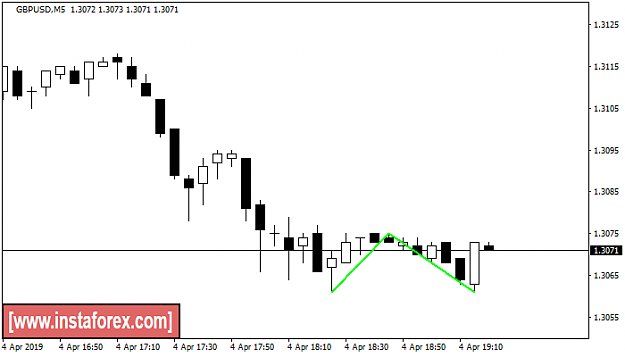
Pattern: Double Bottom was formed on 04.04 at 16:20:27 (UTC+0)
Attached Image (click to enlarge)
The Double Bottom pattern has been formed on GBPUSD M5. Characteristics: the support level 1.3061; the resistance level 1.3075; the width of the pattern 14 points. If the resistance level is broken, a change in the trend can be predicted with the first target point lying at the distance of 14 points.
The M5 and M15 time frames may have more false entry points.
GBPUSD Pattern: Double Bottom was formed on 04.04 at 16:20:27 (UTC+0) {image} The Double Bottom pattern has been formed on GBPUSD M5. Characteristics: the support level 1.3061; the resistance level 1.3075; the width of the pattern 14 points. If the resistance level is broken, a change in the trend can be predicted with the first target point lying at the distance of 14 points. The M5 and M15 time frames may have more false entry points.
Ignored
bro u working for Instaforex ??
Never follow/blame others,Patience is the key skill for Succesfull trading.
GBPUSD Pattern: Double Bottom was formed on 04.04 at 16:20:27 (UTC+0) {image} The Double Bottom pattern has been formed on GBPUSD M5. Characteristics: the support level 1.3061; the resistance level 1.3075; the width of the pattern 14 points. If the resistance level is broken, a change in the trend can be predicted with the first target point lying at the distance of 14 points. The M5 and M15 time frames may have more false entry points.
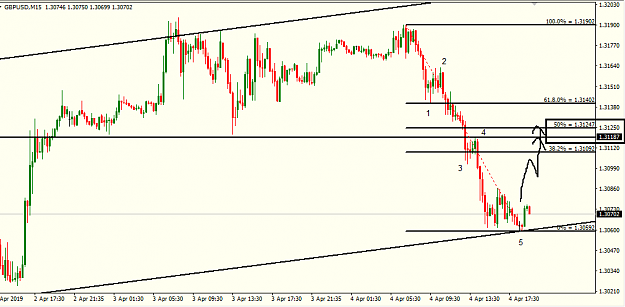
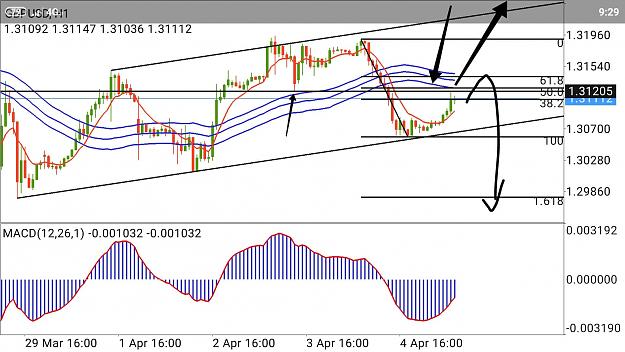
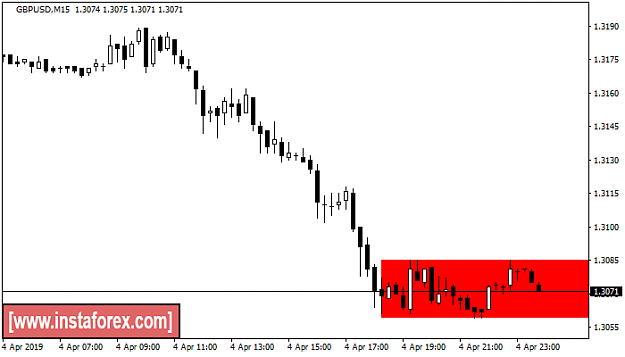
Pattern: Bullish Rectangle was formed on 04.04 at 20:50:41 (UTC+0)
Attached Image (click to enlarge)
According to the chart of M15, GBPUSD formed the Bullish Rectangle. This type of pattern indicates a trend continuation. It consists of two levels: resistance 1.3085 - 0.0000 and support 1.3059 – 1.3059. In case the resistance level 1.3059 - 1.3059 is broken, the instrument is likely to follow the bearish trend.
The M5 and M15 time frames may have more false entry points.
GBPUSD Pattern: Bullish Rectangle was formed on 04.04 at 20:50:41 (UTC+0) {image} According to the chart of M15, GBPUSD formed the Bullish Rectangle. This type of pattern indicates a trend continuation. It consists of two levels: resistance 1.3085 - 0.0000 and support 1.3059 – 1.3059. In case the resistance level 1.3059 - 1.3059 is broken, the instrument is likely to follow the bearish trend. The M5 and M15 time frames may have more false entry points.
Ignored
Dude, that huge URL there is annoying. I would never use a broker who does this kind of shit. All red flags would be up.
Everyone can see the chart, but only a few can actually read it.