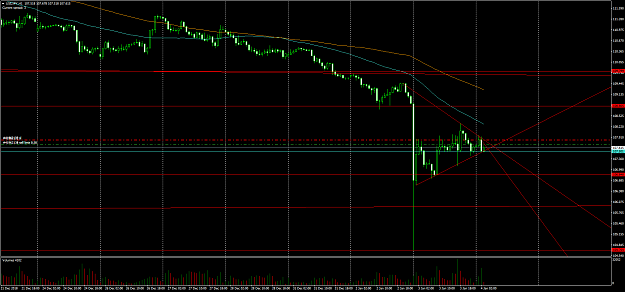
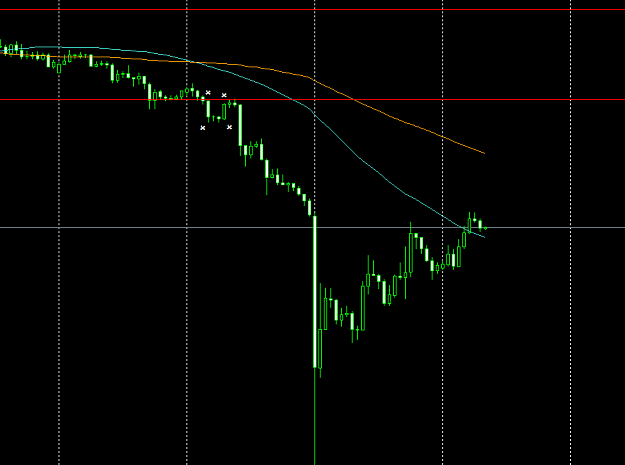
DislikedI'm keen to see what others are thinking for their weekly/monthly charts, and in general. Is this UJ dump an anomaly, or not? Looking at my weekly chart, If it stays below 108.8 by the end of the week will it continue straight south, or will this week form the most amazing hammer of all time ?? Any ideas anyone? BTW those mauve crosses you can see are where I TP on my shorts up above 111.8. DOH !!!!! I just added a lower TL putting UJ in the pointy end of a weekly flag ( NB, I'm not sure if a flag can be re entered per se once it has broken out....Ignored
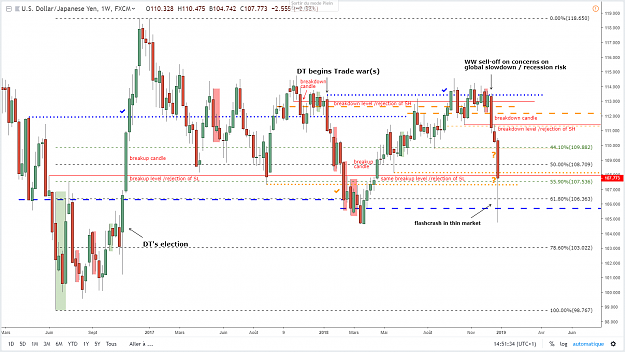
I think the MT dynamic on UJ is the following :
1) reversal down on Q1 2018 via DT starting trade wars (=> bad expectations for global growth in the MT/LT because of trade wars - just economics 101)
2) deep retrace/dead cat bounce from Q2 2018 to Q3 2018
3) new reversal down in the making now on facts (expectations becoming slowly facts) : that one should trigger the impulsive part of the MT move (with a final target deep below 100?). I think now only DT finding a deal with China and stopping tariffs threats on EZ (in short, ending trade wars) will abort it.
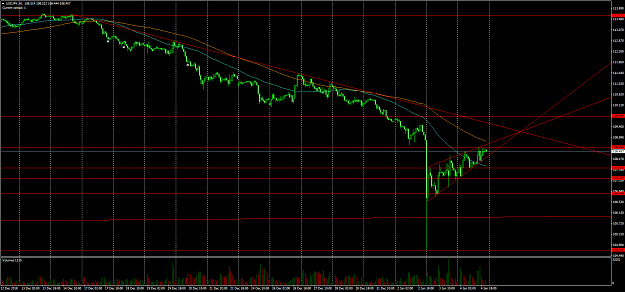
Shaking my head for yesterday. My MT target 106.6x hit while I was scalping to the long side. I guess the final appropriate reading is a flash crash on global concerns in very thin market hours ? hmm. In anycase, sideline here. That weekly candle is huge. We are propably going to trade inside it for a while.
Attached Image (click to enlarge)
1