• Home
  • Forums
  • Trades
  • News
  • Calendar
  • Market
  • Brokers
  • Login
  • Join
  • User/Email: Password:
  • 2:20am
Menu
  • Forums
  • Trades
  • News
  • Calendar
  • Market
  • Brokers
  • Login
  • Join
  • 2:20am
Sister Sites
  • Metals Mine
  • Energy EXCH
  • Crypto Craft

Options

Bookmark Thread

First Page First Unread Last Page Last Post

Print Thread

Similar Threads

Brokers with different timezones 9 replies

Confused with timezones and daily charts 3 replies

MT4 and Chart Timezones 5 replies

Timezones and Daylight Saving 3 replies

Backtesting results with different timezones 5 replies

  • Trading Systems
  • /
  • Reply to Thread
  • Subscribe
  • 14
Attachments: Attacking the problem of different timezones and the delay to enter trades
Exit Attachments
Tags: Attacking the problem of different timezones and the delay to enter trades
Cancel

Attacking the problem of different timezones and the delay to enter trades

  • Last Post
  •  
  • 1 2Page 3 4
  • 1 2Page 3 4
  •  
  • Post #41
  • Quote
  • Oct 7, 2006 3:05pm Oct 7, 2006 3:05pm
  •  Vince-AC
  • | Joined Apr 2006 | Status: Member | 126 Posts
Quoting GreatYves
Disliked
Explanation: Breakout not always apparent depending on what broker you base your H4 charts. They're is 4 slightly different charts depending on where is your broker server in the world. Some were lucky seeing the early monday breakout on gbp-usd, some didn't see it before price explosion.. and completly missed it. Worst went against...

That is why some try to make indicator better smoothing the 4 different set of trend line into one, over a H1 chart for more accuracy viewing. I appreciate that this matter is beeing adress and i look further in testing this indicator if some would make it available TIA.
Ignored
thanks for the reply, am still to dense to understand
 
 
  • Post #42
  • Quote
  • Oct 7, 2006 3:20pm Oct 7, 2006 3:20pm
  •  Vince-AC
  • | Joined Apr 2006 | Status: Member | 126 Posts
alright, let's make this easy. can anyone post a picture of two charts, taken at the same time, but in different time zones, that show a difference in candle formations?
 
 
  • Post #43
  • Quote
  • Oct 7, 2006 3:31pm Oct 7, 2006 3:31pm
  •  4rex
  • | Joined Feb 2006 | Status: Member | 270 Posts
Quoting GreatYves
Disliked
Explanation: Breakout not always apparent depending on what broker you base your H4 charts. They're is 4 slightly different charts depending on where is your broker server in the world. Some were lucky seeing the early monday breakout on gbp-usd, some didn't see it before price explosion.. and completly missed it. Worst went against...

That is why some try to make indicator better smoothing the 4 different set of trend line into one, over a H1 chart for more accuracy viewing. I appreciate that this matter is beeing adress and i look further in testing this indicator if some would make it available TIA.
Ignored
GreatYves,

First of all thank you for your explanation, at least one person is trying to help us. It is still not clear to me... Ok, What do you mean four different charts? Do you mean that they start their 4hr candles at different times? I guess what is not clear is WHY the 4hr candles are different because the server are in a different part of the world/timezone? I can't picture the difference! The buying and selling on early Monday (as you chose to explain) is happening at that particular moment in time/space everywhere in the world...the only difference is what our watch says is our local time.
Blah, Blah, Blah,,,,boy am I dumb or what! maybe is so simple that I can't grasp it!

Thank You
All 4 1 and 1 4 All
 
 
  • Post #44
  • Quote
  • Oct 7, 2006 3:39pm Oct 7, 2006 3:39pm
  •  GreatYves
  • | Joined Aug 2006 | Status: AKA DareDevil | 527 Posts
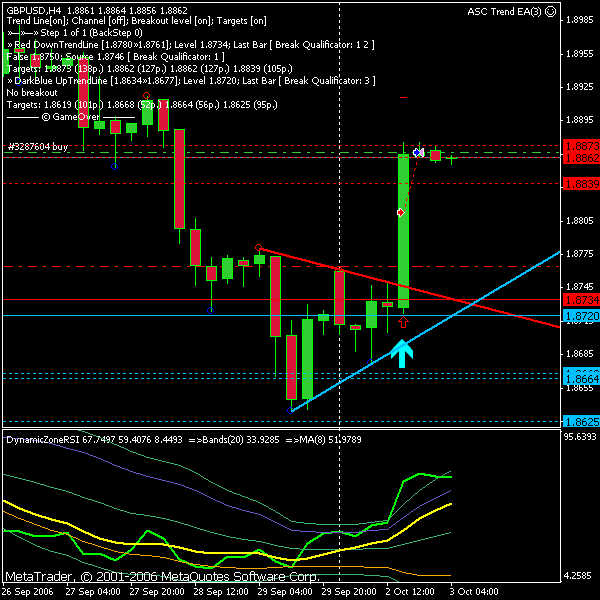
Here is GMT+3 monday morning GBP-USD:


And also check this link:http://www.forexfactory.com/forexfor...&postcount=142
Attached Image
Harmonics and Pitchfork using korHarmonics from TradingArsenal
 
 
  • Post #45
  • Quote
  • Oct 7, 2006 6:33pm Oct 7, 2006 6:33pm
  •  joe-who
  • | Joined Aug 2006 | Status: Member | 26 Posts
real-time charting is just that. Real-Time! It shouldn't matter what time your charting software is set to or which part of the world you're sitting in. Eventhough our clocks may read differently candles forming at a particular minute in time are still forming at the exact same time that's why we all see the same spikes at news announcements etc.
 
 
  • Post #46
  • Quote
  • Oct 7, 2006 7:05pm Oct 7, 2006 7:05pm
  •  spartan
  • | Joined Jul 2006 | Status: Member | 129 Posts
Quoting Horace Kent
Disliked
Hi spartan,

This is what made me post this, and I quote:

"All trend line analysis will be done on the four hour chart compression. By process of elimination of all chart compressions, I have concluded that only the four hour compression is needed. The four hour compression generates less trend line breaks and more accurate price projections than any other time compression. All analysis shown of trend lines will be conducted of the four hour compression." (From Mouteki's 4 hour trendline document)
________________________

I think Mouteki has made it abundantly clear in this paragraph. Why reinvent a wheel that works?

The search for filters, on my part, is to find that which I KNOW, by Mouteki's own admission to me, has not been revealed. It is an effort to discover the complete system.
Ignored
Thanks for clearing that up, Horace.
What we are trying to do here is not reinventing the wheel rather it is fine tuning it or trying different gear ratios to see if it can show us something.

As you say, Mouteki found out that 4-hour conpression is needed to avoid false trendline breaks and to give more accurate price projection and in this thread, we are not reinventing his findings.
By using 20-hour high or low of 1H candle to draw trendlines, you are taking advantage of his findings in terms of avoiding false trendline breaks and projecting accurate price projection but at the same time attempting to solve problems associated with the use of 4H timeframe.

With that said, please see my last post describing disadvantage of using only 4H chart to trigger trades and this will also give us the same signals for everyone trading the method which is not the case with the original method.

I hope that you understand what we are doing here. What we are trying to do here is to bring out the best of both 1H and 4H timeframes.

____________________________________________________________

To those who find this thread offensive for some reasons:

I am not trying to be rude or offend anyone but if anyone finds this thread beyond his/her comprehension then that's your problem so please either read the thread carefully to understand what we really are doing here or simply ignore and go to other threads.
I wish to have only constructive discussion going in this thread.
Thanks.
 
 
  • Post #47
  • Quote
  • Oct 7, 2006 7:30pm Oct 7, 2006 7:30pm
  •  spartan
  • | Joined Jul 2006 | Status: Member | 129 Posts
Quoting BurgerKing
Disliked
The original article specifically state using H4 to avoide whipsaw/reveral. Using
H1 charts will definitely result in "earlier" entry signals BUT some of these signals are premature as you already have seen when you apply Mouteki on H1.

Sure H1 mouteki solves the timezone problem but it also created false entry signals.

Which one is more important?
a) Early signals with higher probability of reversal (but of course, earlier signal = early profit if the signal is true)
b) Late signals with lowered probability of reversal (but late signals is also a disadvantage as the steam may have left the move already)

Hmm...
Earlier I was trying out ways to use H1 charts but grouping each candle into 4 .. problem is, this will cause TimeZone problem as well; when must I start off the grouping? must I start it off on Monday Asia Open (Sunday 6PM EST)? But there are only 118 trading hours a week - 118 is not divisible by 4!!!!

Right now, i am studing using pure H1 chart, BUT needing at least 2 candles (or more) below/above the trendlines as a valid signals.

Your inputs are appreciated!
Ignored
I think what we should do here is to try to get the best of both 1H and 4H timeframes.
If you use the 20-hour high/low of 1H candles, that would be equivalent to using the high/low of five 4H candles thus gives you the same trendline as 4H chart.

With the original Mouteki method you are getting four kinds of signals (see my post #27). In terms of probability, you get each one 25% of the time.

On the average, your average signal is telling you that 2.5 1H candles have closed beyond the trendline during the formation of the 4H candle that's giving you the entry signal.

To get the same effect, we can either go down to 30M chart, use the 20-hour highs or lows (40-candle highs/lows) to draw trendlines, and look for five 30M candle closes beyond the trendlines...or simply go with 1H chart but use either 2 or 3 1H candle closes as entry signals.
We can off course explore different numbers of candle closes for entry but we can go from there.
 
 
  • Post #48
  • Quote
  • Oct 7, 2006 8:32pm Oct 7, 2006 8:32pm
  •  spartan
  • | Joined Jul 2006 | Status: Member | 129 Posts
Quoting MNFX
Disliked
We must assume what Mouteki says is true. So, if what he says is true this becomes fact.
Ignored
LOL outside of the world of religion, your argument is a fallacy.

Quoting MNFX
Disliked
The fact is we trade on 4hr charts and no less. We know not to trade on anything lower than 4HR and GMT.
After looking at trade examples of Mouteki's charts we know he his trading gmt. I use a broker who uses metatrader. My chart candles match (from what I have seen) all of Mouteki's candles.
Bottom line is this is a world market that you should be trading on a world standard of gmt. Not gmt+1 or 4 with this strategy. I live in the States (God Bless the USA) and I don't go off of gmt -5 for Mouteki.
Ignored
Have you ever considered the fact that there can be only four kinds of 4H charts in terms of candle formation (except the possible difference in the first and last few hours of trading week)?
Have you also considered the fact that regardless of it being GMT or not each kind of 4H chart gives you similar results in a long run?
Considering these facts, I find the arguments of some of nay-sayers' of this thread quite amusing.


Quoting MNFX
Disliked
The Problems of Different Timezones = The Problem is Your Charting Software.
OR
The Probelm of Different Timezones = What Trading Strategy You Are Using.

Good luck to you all and please don't complicate the few simplicities you have for trading a dynamic market like this. Stick with the basics and you may surprise yourself.
Ignored
The problem of different timezones is neither of two you are giving but it is the fact that you sometimes get what seem to be premature signals that turn out to be false and your chart is the only one (of the four mentioned above) that gave the signal.
No matter what timezone your server uses, you get that sooner or later even if you are using GMT.
Not only does it occasionaly give you premature ones, you occasionaly get delayed signals as compared to the other three timezone types.

Again, we are not forcing anyone to believe or even participate in the discussion of this thread. We are respecting your freedom of choice by not forcing.
Equally, I'd like you to respect our freedom to explore what we think is worth exploring. We are not making the method more complicated for anyone either...remember we are not growing children in this thread. You can always avoid reading what you think is not for you.
We are just discussing what we believe may help our Mouteki trading and it's as simple as that.
But if you believe we're wrong you can start a thread for whatever topic you choose so long as admins at FF allow it. I hope to have only constructive discussion going in this thread.
Thanks.
 
 
  • Post #49
  • Quote
  • Oct 7, 2006 9:07pm Oct 7, 2006 9:07pm
  •  et_phonehome_2
  • | Joined May 2006 | Status: Member | 809 Posts
Quoting Vince-AC
Disliked
alright, let's make this easy. can anyone post a picture of two charts, taken at the same time, but in different time zones, that show a difference in candle formations?
Ignored
Check out GBP/USD Mouteki thread:

Why the Differences:
http://www.forexfactory.com/forexfor...&postcount=407

Example of Demand Cross:
http://www.forexfactory.com/forexfor...&postcount=390

Demand Line Cross using MIG Broker:
http://www.forexfactory.com/forexfor...&postcount=373

Demand Line Cross using IBFX Broker:
http://www.forexfactory.com/forexfor...&postcount=360

Which would you prefer????
 
 
  • Post #50
  • Quote
  • Oct 7, 2006 9:41pm Oct 7, 2006 9:41pm
  •  spartan
  • | Joined Jul 2006 | Status: Member | 129 Posts
Quoting 4rex
Disliked
GreatYves,

First of all thank you for your explanation, at least one person is trying to help us. It is still not clear to me... Ok, What do you mean four different charts? Do you mean that they start their 4hr candles at different times? I guess what is not clear is WHY the 4hr candles are different because the server are in a different part of the world/timezone? I can't picture the difference! The buying and selling on early Monday (as you chose to explain) is happening at that particular moment in time/space everywhere in the world...the only difference is what our watch says is our local time.
Blah, Blah, Blah,,,,boy am I dumb or what! maybe is so simple that I can't grasp it!

Thank You
Ignored
Let me try to help you a bit.

Firstly, a 4H candle tells you 4 things: opening price, closing price, highest price, and lowest price in the 4-hour time period you are refering to.

______________________________________________________________

Let's say your chart is set to GMT(or +4, +8, -4, -8...) so what the candle you are looking at is telling you is that the opening price, closing price, highest price and lowest price were as such from one of the following time periods:

0:00 GMT to 4:00 GMT, 4:00 GMT to 8:00 GMT, 8:00 GMT to 12:00 GMT
12:00 GMT to 16:00 GMT, 16:00 GMT to 20:00 GMT, and 20:00 GMT to 0:00 GMT
______________________________________________________________

However, your friends using timezone GMT +1, +5, +9, -3, -7 and so forth, they are getting a slightly different set of data because their 4H candles are telling them the openings, closings, highests, lowests of the following time periods:

23:00 GMT to 3:00 GMT, 3:00 GMT to 7:00 GMT, 7:00 GMT to 11:00 GMT
11:00 GMT to 15:00 GMT, 15:00 GMT to 19:00 GMT, and 19:00 GMT to 23:00 GMT.
______________________________________________________________

And your friends using timezone GMT +2, +6, +10, -2, -6 and so forth, they are getting a slightly different set of data because their 4 H candles are telling them the openings, closings, highests, lowests of the following time periods:

22:00 GMT to 2:00 GMT, 2:00 GMT to 6:00 GMT, 6:00 GMT to 10:00 GMT, 10:00 GMT to 14:00 GMT, 14:00 GMT to 18:00 GMT, 18:00 GMT to 22:00 GMT.
_______________________________________________________________

Finally, your friends using the timezone GMT +3, +7, +11, -1, -5, -9 and so forth, they are getting a slightly different set of data because their 4 H candles are telling them the openings, closings, highests, lowests of the following time periods:

21:00 GMT to 1:00 GMT, 1:00 GMT to 5:00 GMT, 5:00 GMT to 9:00 GMT, 9:00 GMT to 13:00 GMT, 13:00 GMT to 17:00 GMT, and 17:00 GMT to 21:00 GMT
_______________________________________________________________

Since they get different set of opening, closing, high and low of candles, the aforementioned four group of traders get slightly diffrent candle formations thus occasionaly give you different entry signals, or same signal but at 4 different timings.
Hope this helps.
 
 
  • Post #51
  • Quote
  • Oct 7, 2006 10:33pm Oct 7, 2006 10:33pm
  •  4rex
  • | Joined Feb 2006 | Status: Member | 270 Posts
Hello,

Spartan,

Yes, I finally got it. Thank you very much for taking the time to clarify it for me and Vince-AC and the rest of members who were following our questions. And thank you Spartan for the charts. My next post will be to ask if there is a broker in the U.S with a demo account using MT4 with an eastern standard time. But I will create a new post and not interrupt the flow of this thread.

Thanks again
All 4 1 and 1 4 All
 
 
  • Post #52
  • Quote
  • Oct 8, 2006 12:20am Oct 8, 2006 12:20am
  •  TantumVerum
  • | Joined Sep 2006 | Status: Member | 135 Posts
Quoting spartan
Disliked
LOL outside of the world of religion, your argument is a fallacy.


Have you ever considered the fact that there can be only four kinds of 4H charts in terms of candle formation (except the possible difference in the first and last few hours of trading week)?
Have you also considered the fact that regardless of it being GMT or not each kind of 4H chart gives you similar results in a long run?
Considering these facts, I find the arguments of some of nay-sayers' of this thread quite amusing.


The problem of different timezones is neither of two you are giving but it is the fact that you sometimes get what seem to be premature signals that turn out to be false and your chart is the only one (of the four mentioned above) that gave the signal.
No matter what timezone your server uses, you get that sooner or later even if you are using GMT.
Not only does it occasionaly give you premature ones, you occasionaly get delayed signals as compared to the other three timezone types.

Again, we are not forcing anyone to believe or even participate in the discussion of this thread. We are respecting your freedom of choice by not forcing.
Equally, I'd like you to respect our freedom to explore what we think is worth exploring. We are not making the method more complicated for anyone either...remember we are not growing children in this thread. You can always avoid reading what you think is not for you.
We are just discussing what we believe may help our Mouteki trading and it's as simple as that.
But if you believe we're wrong you can start a thread for whatever topic you choose so long as admins at FF allow it. I hope to have only constructive discussion going in this thread.
Thanks.
Ignored

I don't think anything you stated is anywhere close to being relative with any of my points.
First, it is not your system or mine and maybe it isn't even Mouteki's. But Mouteki is explaining the way he utilizes this strategy so it is just that, Mouteki Trading. So my friend you are very wrong laughing at my comment about Mouteki and fact. We can only know what we were told on how he utilizes supply & demand on 4HR charts (which happen to GMT based). Though it may not be the whole story it is the story as it is today and my friend that is fact, it is what is or whatever you want to call it.
I fully understand your statment about 4HR charts, but you obviously didn't read my previous posts. GMT is GMT time and when trading higher time frames anything over 1HR it would behoove you to trade a charting software using anything but GMT based in my honest unprofessional opinion. This is just silly. QUALIFIER: Except unless your you are trading your own specific strategy based on your specific rules based on your own timezone whatever it may be.

Lastly, I am not a very religous person, but I do know one thing. THE GREATEST TRICK THE DEVIL EVER PLAYED ON MORTAL MAN WAS TO MAKE THEM BELIEVE HE DOESN'T EXIST. How you like them apples?
 
 
  • Post #53
  • Quote
  • Oct 8, 2006 1:08am Oct 8, 2006 1:08am
  •  spartan
  • | Joined Jul 2006 | Status: Member | 129 Posts
Quoting 4rex
Disliked
Hello,

Spartan,

Yes, I finally got it. Thank you very much for taking the time to clarify it for me and Vince-AC and the rest of members who were following our questions. And thank you Spartan for the charts. My next post will be to ask if there is a broker in the U.S with a demo account using MT4 with an eastern standard time. But I will create a new post and not interrupt the flow of this thread.

Thanks again
Ignored
I'm glad I could help you understand it.
I wasn't the one who posted the chart though.
 
 
  • Post #54
  • Quote
  • Oct 8, 2006 1:36am Oct 8, 2006 1:36am
  •  spartan
  • | Joined Jul 2006 | Status: Member | 129 Posts
Quoting MNFX
Disliked
I don't think anything you stated is anywhere close to being relative with any of my points.
First, it is not your system or mine and maybe it isn't even Mouteki's. But Mouteki is explaining the way he utilizes this strategy so it is just that, Mouteki Trading. So my friend you are very wrong laughing at my comment about Mouteki and fact. We can only know what we were told on how he utilizes supply & demand on 4HR charts (which happen to GMT based). Though it may not be the whole story it is the story as it is today and my friend that is fact, it is what is or whatever you want to call it.
I fully understand your statment about 4HR charts, but you obviously didn't read my previous posts. GMT is GMT time and when trading higher time frames anything over 1HR it would behoove you to trade a charting software using anything but GMT based in my honest unprofessional opinion. This is just silly. QUALIFIER: Except unless your you are trading your own specific strategy based on your specific rules based on your own timezone whatever it may be.

Lastly, I am not a very religous person, but I do know one thing. THE GREATEST TRICK THE DEVIL EVER PLAYED ON MORTAL MAN WAS TO MAKE THEM BELIEVE HE DOESN'T EXIST. How you like them apples?
Ignored

I apologize if I offended you with my LOL.
If you wish to trade the Mouteki method blindedly, then I guess it's good for you.
As I said earlier, it is my wish that this thread is used for what is relevant to this thread. I'd appreciate your cooperation.
 
 
  • Post #55
  • Quote
  • Oct 8, 2006 5:06am Oct 8, 2006 5:06am
  •  Uphios
  • | Joined Sep 2006 | Status: Forex Slave | 208 Posts
Just felt I had to join in on this one having raised the issue some weeks ago. For those saying that using a 1 hour chart is not Moutiki, they are wrong, it is very much Moutiki. Forget the 4 hour thing and think of the principal. We are looking for the extremes of price action in a 20 hour period in order to identify the highs and/or lows within a trend. We are then saying that when a [trend] line joining these identified extremes is breached we have a possible break of trend and an entry point. 4 hour charts are simply a convenient way of charting this but does give 4 differing signals and with it 4 different targets and associated stop loss. For Moutiki (the person) I suspect he is not bothered by this. If a signal shows on his chart and not on one in mid-west <?xml:namespace prefix = st1 ns = "urn:schemas-microsoft-com:office:smarttags" /><st1:country-region><st1lace>USA</st1lace></st1:country-region> so what? Other times it will be the other way round. He simply plays the charts as he sees them.<?xml:namespace prefix = o ns = "urn:schemas-microsoft-com:office:office" /><o></o>

The consequences of 4 hour charts is dire. I run several 4 hour charts offset by time zones and have had totally conflicting entry signals on the same instrument at the same new 4 hour bar used for entry. Clearly one of them is wrong! (if not both).<o></o>

It seems to me that one hour charts must be the way to go. I think the relevant point should be the extreme in 20 hours so I would count 10 bars either side, not 8. Entry into a position can not therefore occur until at least 10 hours after the last extreme and this is a problem. Moutiki can show an entry just 8 hours after the last extreme and he makes it clear that delay can cause you to miss the opportunity. Of course this is not always the case but I do no know what to do about this problem.<o></o>

Whatever we end up with will still never be 100%, in fact as Moutiki stands I have made more pips playing the absolute reverse than playing with the method. This is simply because, as my back testing revealed, there are more false signals than correct ones. When Moutiki method is correct it usually picks up an entry part way through what turns out to be a change of trend and if the target is good you pick up all of the back half of that change.<o></o>
This space intentionally left blank.
 
 
  • Post #56
  • Quote
  • Oct 8, 2006 8:38am Oct 8, 2006 8:38am
  •  et_phonehome_2
  • | Joined May 2006 | Status: Member | 809 Posts
MNFX

I agree with you that GMT is GMT, but it does make difference where the open/close starts with each broker for the timeframes. In my earlier post, IBFX got the signal earlier compared to MIG, that makes a difference in terms of PIPs though the current bid/ask price may be the same. Yes, all prices are almost the same, its just formation of the candle or bar for that TIMEFRAME will be different.

The system which one trades makes a difference. In Mouteki system, IBFX makes a difference compared to MIG for entry, but then with exits, MIG would give you an earlier chance to get out if you are strictly trading the charts and are not holding for the number of PIPs you can get from the system. Someone I know is using ICHIMOKU system, I get the signals earlier on my charts with MIG while IBFX lags.

My point is, it all depends which trading system you are using, and all brokers does not open and close at the same time, that is, their books.

I used to couldn't understand why the difference, but soon came to realize when viewing different brokers using Metatrader that not all were the same. Its also why some EAs in forward testing does not work on mine, but will work with other brokers.... It gets frustrating....
 
 
  • Post #57
  • Quote
  • Oct 12, 2006 6:31am Oct 12, 2006 6:31am
  •  ART_1_
  • | Joined Apr 2006 | Status: Member | 178 Posts
hi fukinagashi,

your indicator which you made is great but it has a small glitch, it removes always all objects from the chart. if i draw some other trendlines or fib retracement or horizontal lines or any object, then they all disappear after a few seconds.

is there any way how to fix it, if it isnt to much work?

it would be great

Attached File(s)
File Type: mq4 MoutekLineNextGenH1.mq4   21 KB | 292 downloads
 
 
  • Post #58
  • Quote
  • Oct 12, 2006 10:26am Oct 12, 2006 10:26am
  •  Horace Kent
  • | Joined Jun 2006 | Status: ©u®r€nc¥ Ana£¥$t &amp; T®ad£r | 464 Posts
Quoting spartan
Disliked
I am not trying to be rude or offend anyone but if anyone finds this thread beyond his/her comprehension then that's your problem so please either read the thread carefully to understand what we really are doing here or simply ignore and go to other threads.
I wish to have only constructive discussion going in this thread.
Thanks.
Ignored
I'm sorry spartan, I was wrong, and you're right. To each their own. Nothing wrong with trying new things and expressing different ideas. Good luck in your endeavours.

best,
HK
 
 
  • Post #59
  • Quote
  • Edited 7:36pm Oct 12, 2006 5:20pm | Edited 7:36pm
  •  accrete
  • Joined Jan 2006 | Status: Pips Ahoy! | 1,130 Posts
Good thread and idea you've started here fukinagashi. As i'm a proponent of what i've coined 4Dcharting (using lower time frame charts with higher time frame data in the mix) i like the idea proposed here, in particular looking at multiple closes outside TDTLs (which i've been using for many months since reading DeMark's great book). My thoughts on charting/TA include the idea that multiple hits on a lower time frame (or in our case closes) at a known suppor/resistance may have more validity than a single hit on a larger time frame. I know this thread is in the Mouteki niche forum and the bigM based the original on 4hr charts, though i find no problem looking at the 1hr if it helps bring in the pips. And in the end, this model is based on a known and proven style from a great trader Tom DeMark as written in his book "The New Science of Technical Analysis"... As a wise old man (King Solomon) once wrote; "There is nothing new under the sun"...we must keep in mind, that just about any system or model these days is just a rehash and hack of someone else's work, as is the Mouteki Trading Model (just as mine is or any i've seen here at FF) is. Just ramblin'.

As a side note, i have forwarded the indicator's post link to a fellow trader and MT4 coder as he fixed a similar bug in an indicator he and i were working on. Hopefully if he has the time the "erasing" bug will be fixed and we can keep the indicator on the chart with our other TA.

Post Script: My friend here at FF was able to fix the bug, now the indicator can be used with any number of other MT4 tools on the same chart and they are all compatible. Yippie. I would mention his name but then he might be deluged with bug fixes. Suffice it to say he is a great help and his behind the scene assistance is greatly appreciated! I've given the link to the indicator directory at the Mouteki Resource page just in case there are other mods we want in the future, this link will still be good:

Mouteki Indicators

Cheers,
Thom
 
 
  • Post #60
  • Quote
  • Oct 13, 2006 3:40am Oct 13, 2006 3:40am
  •  ART_1_
  • | Joined Apr 2006 | Status: Member | 178 Posts
great accrete, thanks
 
 
  • Trading Systems
  • /
  • Attacking the problem of different timezones and the delay to enter trades
  • Reply to Thread
    • 1 2Page 3 4
    • 1 2Page 3 4
0 traders viewing now
  • More
Top of Page
  • Facebook
  • Twitter
About FF
  • Mission
  • Products
  • User Guide
  • Media Kit
  • Blog
  • Contact
FF Products
  • Forums
  • Trades
  • Calendar
  • News
  • Market
  • Brokers
  • Trade Explorer
FF Website
  • Homepage
  • Search
  • Members
  • Report a Bug
Follow FF
  • Facebook
  • Twitter

FF Sister Sites:

  • Metals Mine
  • Energy EXCH
  • Crypto Craft

Forex Factory® is a brand of Fair Economy, Inc.

Terms of Service / ©2023