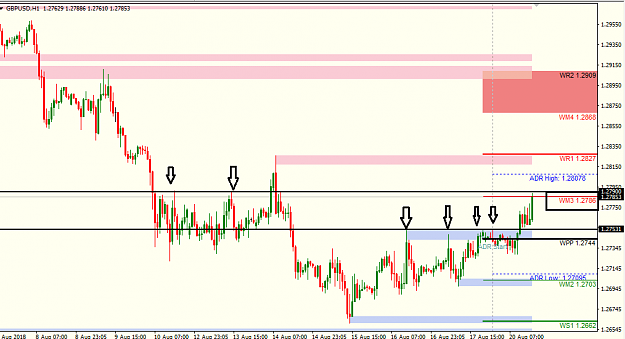
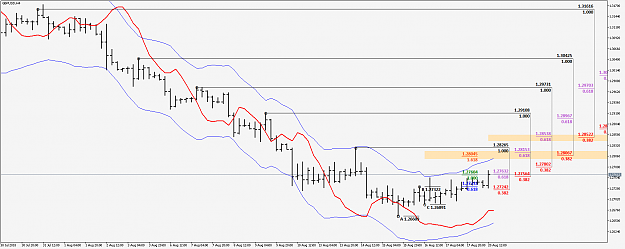
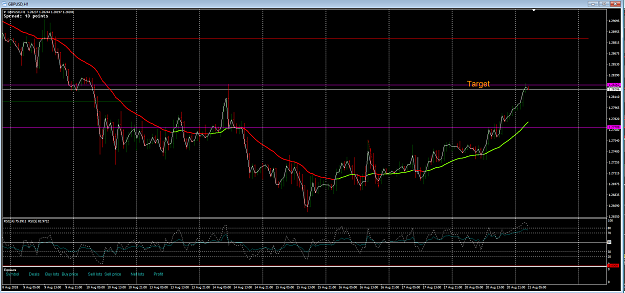
• Home
  • Forums
  • Trades
  • News
  • Calendar
  • Market
  • Brokers
  • Login
  • Join
  • User/Email: Password:
  • 11:58pm
Menu
  • Forums
  • Trades
  • News
  • Calendar
  • Market
  • Brokers
  • Login
  • Join
  • 11:58pm
Sister Sites
  • Metals Mine
  • Energy EXCH
  • Crypto Craft

Options

Bookmark Thread

First Page First Unread Last Page Last Post

Print Thread

Similar Threads

Cable Update (GBP/USD) without Idiots 23 replies

Is it just me or is cable acting random? 44 replies

Why is GBPUSD called cable? 66 replies

Cable (GBPUSD) vs Euro (EURUSD) 26 replies

cable short for gbpusd? 6 replies

  • Interactive Trading
  • /
  • Reply to Thread
  • Subscribe
  • 179,937
Attachments: Cable Update (GBPUSD)
Exit Attachments
Tags: Cable Update (GBPUSD)
Cancel

Cable Update (GBPUSD)

  • Last Post
  •  
  • 1 2319323194Page 231952319623197 36942
  • 1 Page 23195 36942
  •  
  • Post #463,881
  • Quote
  • Aug 20, 2018 11:48am Aug 20, 2018 11:48am
  •  Bydyke
  • | Joined Sep 2009 | Status: Member | 1,251 Posts
Quoting MzansiObi
Disliked
50 ema busy acting as resistance of 4hour chart, thinking of taking a short here
Ignored
EMA 50/H4 is at 2781 but it seems 2771 is having none of it.
 
 
  • Post #463,882
  • Quote
  • Aug 20, 2018 11:55am Aug 20, 2018 11:55am
  •  akim0895
  • | Commercial Member | Joined Feb 2017 | 24,065 Posts
close bE
trump coming
just for a cup of coffee...
 
 
  • Post #463,883
  • Quote
  • Aug 20, 2018 12:10pm Aug 20, 2018 12:10pm
  •  ballballball
  • | Joined Jun 2013 | Status: Member | 138 Posts
Quoting ballballball
Disliked
Buy gu 1.2760 sl 1.2754
Ignored
Thx Trump
 
 
  • Post #463,884
  • Quote
  • Aug 20, 2018 12:59pm Aug 20, 2018 12:59pm
  •  Moty
  • Joined Dec 2017 | Status: Member | 22,287 Posts
out with 35 pips
Attached Image (click to enlarge)
Click to Enlarge

Name: gbp h1.png
Size: 25 KB
 
 
  • Post #463,885
  • Quote
  • Aug 20, 2018 1:01pm Aug 20, 2018 1:01pm
  •  elbert3
  • Joined Dec 2013 | Status: Member | 19,217 Posts
Quoting elbert3
Disliked
It looks to me now on the day chart price cleared my emas and is heading back to meet 10 ema at about 2790 area a possible break of that could lead to 2880 then 2950 . On the 1 hour we have a crossover . 10.20 and 50 ema also cleared 100 ema which again could see the 200 ema as a possible target at 2790 area . So we have a possible day and 1 hour chart showing possible ema targets .4 hour again sees 50 ema at 2790 area with a small trend showing a up movement at this time . Any fail at 2790 rejection could .. could see a move down and if so watch...
Ignored
4 pips away and looking like the plan worked out
 
1
  • Post #463,886
  • Quote
  • Aug 20, 2018 2:07pm Aug 20, 2018 2:07pm
  •  RogerTC
  • | Joined May 2018 | Status: Member | 22 Posts
Looking at the GBP/USD;

Market is sitting around yearly 0.618 (COB) Fibonacci expansion support levels at 1.2429 and 1.2457.

Attached Image (click to enlarge)
Click to Enlarge

Name: yearly.PNG
Size: 573 KB


We dont see a follow through on the macd quaterly trend change which shows very week dynamic pressure.

Attached Image (click to enlarge)
Click to Enlarge

Name: Quaterly.PNG
Size: 687 KB


On the monthly; Trend turned into sell and market is pushing through 0.618 (F5) Fibonacci support level at 1.2899. Beneath that 0.618 (COB) monthly expansion at 1.2502 will stand as the next support which the market will likely test it.

Attached Image (click to enlarge)
Click to Enlarge

Name: GBPUSDMonthly.png
Size: 39 KB


Looking at our weekly; We see a down thrust (Min 8 bars below 3*3) and the market is testing cluster (0.618 COB + 1.618 XOP Fibonacci expansions) support zone at 1.2746 and 1.2677. Market may try to take the stop below 1.2588 level.

Attached Image (click to enlarge)
Click to Enlarge

Name: GBPUSDWeekly.png
Size: 49 KB


Daily; We do have a nice down thrust as well. Daily trend change is approaching. We have strong confluence resistance around 1.2970 zone. So that might be a good spot to fade daily trend against the weekly and monthly down trends as per standart trade plan. We might be able to get Dinapoli s B&B sell setup before that as well.

Attached Image (click to enlarge)
Click to Enlarge

Name: GBPUSDDaily.png
Size: 43 KB


We drop lower timeframe to pinpoint our entry for possible B&B Sell Setup. We have nice agreement + confluence (1.00 OP expansion, 0.618 F5 and 0.382 F3 Fibonacci resistance levels) zone at 1.2804- 1.2815 zone and another confluence (F3+F5) zone higher up 1.2853-1.2857

Attached Image (click to enlarge)
Click to Enlarge

Name: GBPUSDH4.png
Size: 52 KB


Please take note of that we are around yearly fibonacci support levels so need to cautious while shorting the market.
Attached Image (click to enlarge)
Click to Enlarge

Name: GBPUSDDailyCombo.png
Size: 28 KB
 
1
  • Post #463,887
  • Quote
  • Aug 20, 2018 3:15pm Aug 20, 2018 3:15pm
  •  elbert3
  • Joined Dec 2013 | Status: Member | 19,217 Posts
Quoting elbert3
Disliked
{quote} 4 pips away and looking like the plan worked out
Ignored
2790 on the nose let's move the profit up to protect . .and I have to possibly look to short
 
2
  • Post #463,888
  • Quote
  • Aug 20, 2018 9:27pm Aug 20, 2018 9:27pm
  •  FloatingCha
  • | Joined May 2013 | Status: Member | 490 Posts
Quoting Ksth
Disliked
please buy more. i can add short =p
Ignored
........... thank you i'm happy with your money
 
 
  • Post #463,889
  • Quote
  • Aug 20, 2018 9:48pm Aug 20, 2018 9:48pm
  •  Ill-b-back
  • Joined May 2011 | Status: Get to the Chopper | 17,905 Posts
Looks like next zone to watch PA
Attached Image (click to enlarge)
Click to Enlarge

Name: GBPUSDDaily.png
Size: 28 KB
Come with me if you want to live....
 
 
  • Post #463,890
  • Quote
  • Aug 20, 2018 10:41pm Aug 20, 2018 10:41pm
  •  Nala66
  • Joined Mar 2016 | Status: Member | 5,546 Posts
Quoting Ill-b-back
Disliked
Looks like next zone to watch PA {image}
Ignored
I am not sure from here, it has hit my last target and the EMA has made the HH on the 1H
Attached Image (click to enlarge)
Click to Enlarge

Name: Screenshot1.png
Size: 66 KB
 
 
  • Post #463,891
  • Quote
  • Aug 20, 2018 10:48pm Aug 20, 2018 10:48pm
  •  Nala66
  • Joined Mar 2016 | Status: Member | 5,546 Posts
It is troubling me a tad that I have a weekly chart target of 2587 but that could be weeks away.

If that fails then the weekly upside target becomes 4486???
 
 
  • Post #463,892
  • Quote
  • Aug 20, 2018 10:53pm Aug 20, 2018 10:53pm
  •  masudsardar
  • | Joined Dec 2016 | Status: Shooting Athlete | 181 Posts
Attached Image (click to enlarge)
Click to Enlarge

Name: GBP.USD.TRADE.jpg
Size: 79 KB
to err is human
 
 
  • Post #463,893
  • Quote
  • Aug 20, 2018 11:42pm Aug 20, 2018 11:42pm
  •  Ill-b-back
  • Joined May 2011 | Status: Get to the Chopper | 17,905 Posts
Quoting Nala66
Disliked
It is troubling me a tad that I have a weekly chart target of 2587 but that could be weeks away. If that fails then the weekly upside target becomes 4486???
Ignored
I think 2587 is a logic spot.
Why is it troubling?
Come with me if you want to live....
 
 
  • Post #463,894
  • Quote
  • Aug 21, 2018 12:30am Aug 21, 2018 12:30am
  •  akim0895
  • | Commercial Member | Joined Feb 2017 | 24,065 Posts
maybe try some short later
wait london open️
just for a cup of coffee...
 
 
  • Post #463,895
  • Quote
  • Aug 21, 2018 12:55am Aug 21, 2018 12:55am
  •  Nala66
  • Joined Mar 2016 | Status: Member | 5,546 Posts
Quoting Ill-b-back
Disliked
{quote} I think 2587 is a logic spot. Why is it troubling?
Ignored
Because if price continues to climb for a week and then turns then I would be caught with a serious drawdown by being in the wrong direction.

That is why I stick to the short term trades then I cannot get caught on the wrong side because I would be stopped out early and have the opportunity to change direction.

I know everyone has differing views on trade duration but quick in and outs suits me fine.
 
 
  • Post #463,896
  • Quote
  • Aug 21, 2018 1:32am Aug 21, 2018 1:32am
  •  kayikayi
  • Joined Jun 2018 | Status: Member | 1,035 Posts
Quoting Nala66
Disliked
It is troubling me a tad that I have a weekly chart target of 2587 but that could be weeks away. If that fails then the weekly upside target becomes 4486???
Ignored
Morning Nala

yes 4486 is totally possible in my opinion....this week and this month are key to decide if this down move we have been in since April is only a correction (in which case we can tag 1.50 once done) or a total "cycle" reversal in which case we will see parity and such.

As far as more immediate levels...I have your 5min chart from last week with the following levels 2831 and 2892 left. (we hit on the nose the previous ones ie 2771 and 2792)

The retracement we are in right now is well underway (slightly more than halfway in)...we might have another 100 pips or so to the upside.
 
 
  • Post #463,897
  • Quote
  • Aug 21, 2018 1:41am Aug 21, 2018 1:41am
  •  Nala66
  • Joined Mar 2016 | Status: Member | 5,546 Posts
Quoting kayikayi
Disliked
{quote} Morning Nala yes 4486 is totally possible in my opinion....this week and this month are key to decide if this down move we have been in since April is only a correction (in which case we can tag 1.50 once done) or a total "cycle" reversal in which case we will see parity and such. As far as more immediate levels...I have your 5min chart from last week with the following levels 2831 and 2892 left. (we hit on the nose the previous ones ie 2771 and 2792) The retracement we are in right now is well underway (slightly more than halfway in)...we...
Ignored
That's correct and as long as we stay above the 5M ema I would be looking to that 2892 next.

On the 1H it is close to that with a 2886.

So as far as I am trading I buy the dips and close at the tops.
 
 
  • Post #463,898
  • Quote
  • Aug 21, 2018 1:44am Aug 21, 2018 1:44am
  •  Nala66
  • Joined Mar 2016 | Status: Member | 5,546 Posts
Something of interest here in that the 1h chart has produced 12 bull bars in a row...is that some kind of record?
 
 
  • Post #463,899
  • Quote
  • Aug 21, 2018 1:45am Aug 21, 2018 1:45am
  •  kayikayi
  • Joined Jun 2018 | Status: Member | 1,035 Posts
great!! question: any reason why you don't use 4h levels? are they less accurate or something the higher in time frames we go?
thx!
 
 
  • Post #463,900
  • Quote
  • Aug 21, 2018 1:52am Aug 21, 2018 1:52am
  •  kayikayi
  • Joined Jun 2018 | Status: Member | 1,035 Posts
Quoting Nala66
Disliked
Something of interest here in that the 1h chart has produced 12 bull bars in a row...is that some kind of record?
Ignored
this tells me they are rushing to hit some levels up in order to slam it down later during FOMC....total speculation on my part i don't pretend to even guess timing of price action...anything is possible in my book
 
1
  • Interactive Trading
  • /
  • Cable Update (GBPUSD)
  • Reply to Thread
    • 1 2319323194Page 231952319623197 36942
    • 1 Page 23195 36942
26 traders viewing now, 5 are members:
imohsin360
,
Invisible
,
Invisible
,
france001
,
MadMoon
  • More
Top of Page
  • Facebook
  • Twitter
About FF
  • Mission
  • Products
  • User Guide
  • Media Kit
  • Blog
  • Contact
FF Products
  • Forums
  • Trades
  • Calendar
  • News
  • Market
  • Brokers
  • Trade Explorer
FF Website
  • Homepage
  • Search
  • Members
  • Report a Bug
Follow FF
  • Facebook
  • Twitter

FF Sister Sites:

  • Metals Mine
  • Energy EXCH
  • Crypto Craft

Forex Factory® is a brand of Fair Economy, Inc.

Terms of Service / ©2023