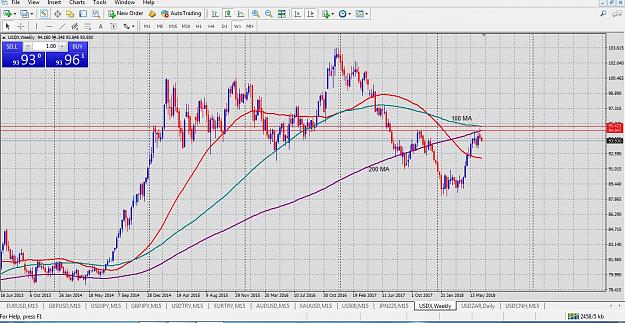
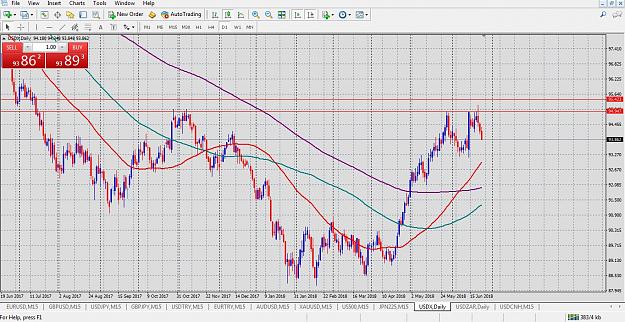
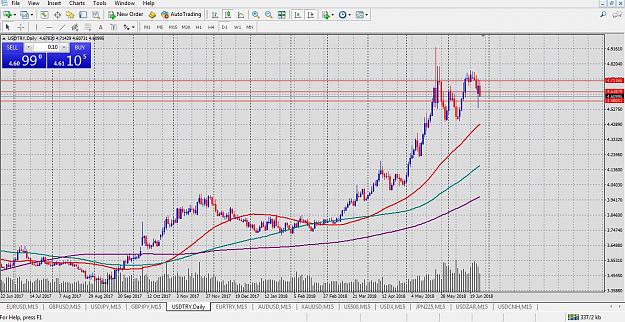
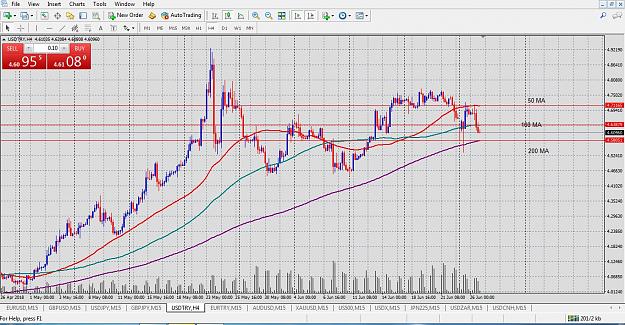
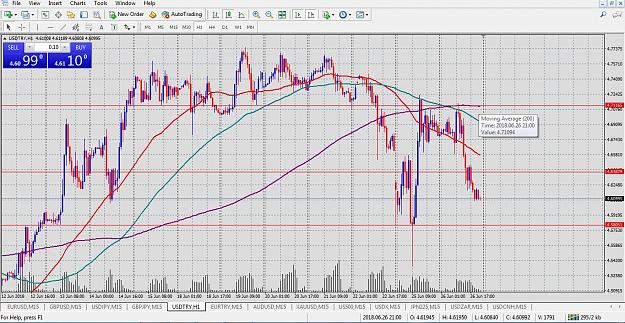
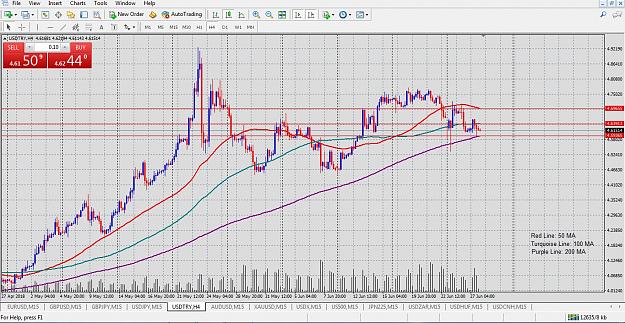
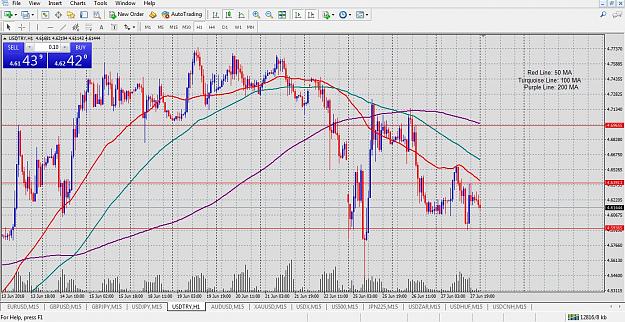
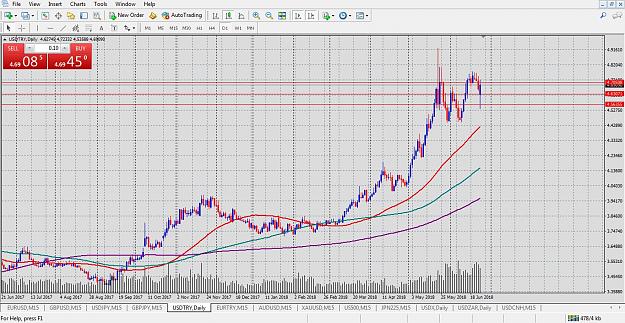
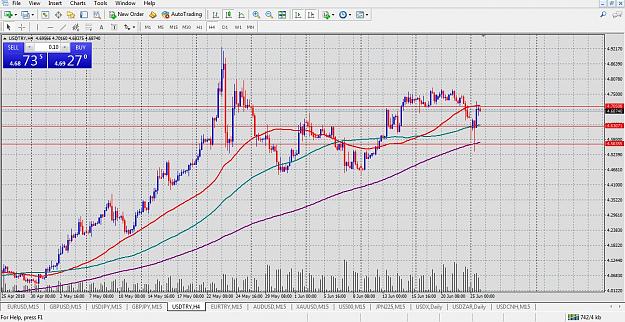
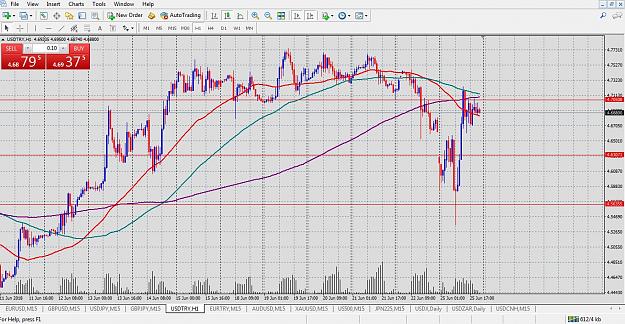
Dislikedhourly chart turning bearish.. 4h 200 MA (moivng average) at artd 4.56.. above that level looks good buy area to me.. if not broken below decisively... {image} {image}Ignored
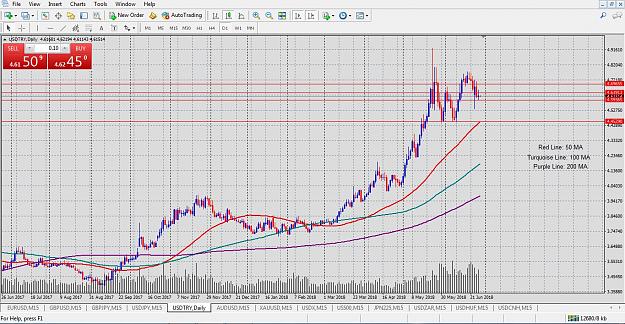
i am more bullish than yesterday..i was bullish in this pair in medium and long term but daily and 4h charts imply that also in short term (days to one month) usd/try is bullish..probably after swap time (NY close) i buy usd/try..
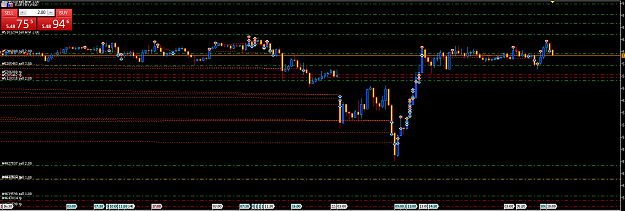
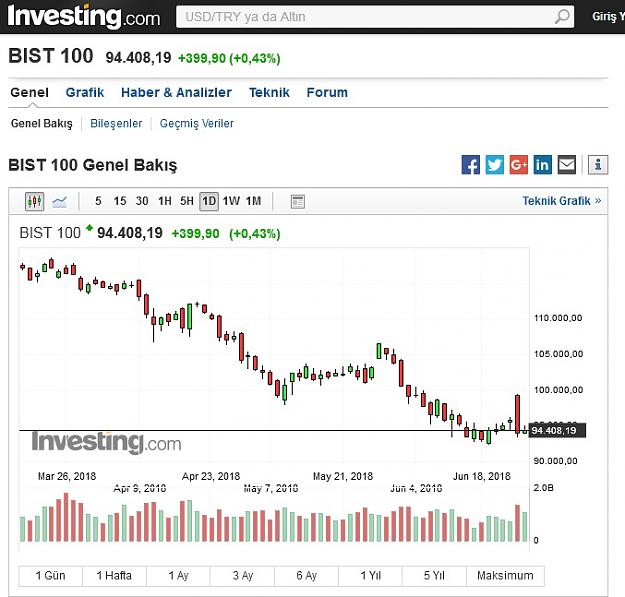
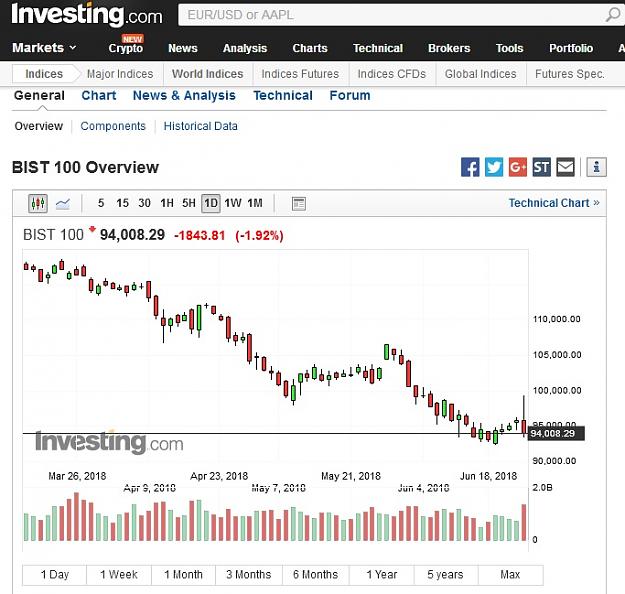
Edit: i am also adding borsa istanbul stock exchange daily chart..it has opened quite high today and close in negative comparing to last friday..
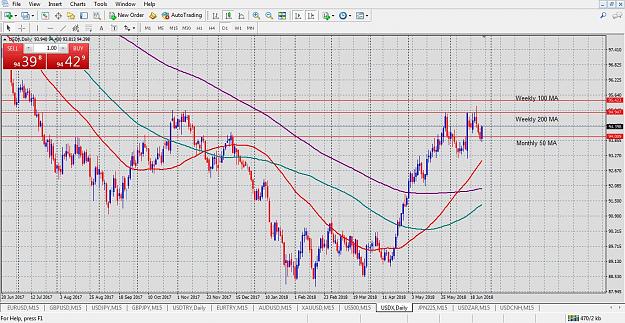
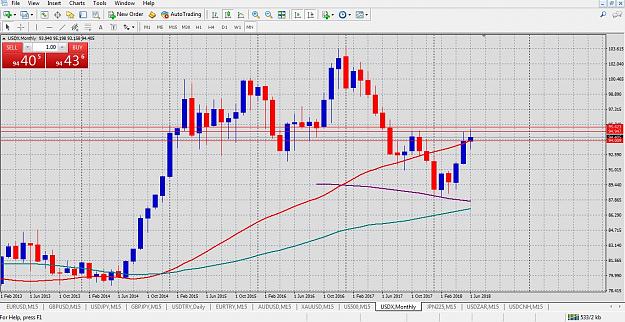
Edit 2: even in such a day that Us Dollar index has dropped, Usd/try has completed day up..that shows lira's weakness and negative future expectations after election..when Usd index start to rise again, lira may lose more and more..
Attached Image(s) (click to enlarge)

make your own analysis and decisions..just giving some perspective..
1