USDJPY Weekly Technical Outlook
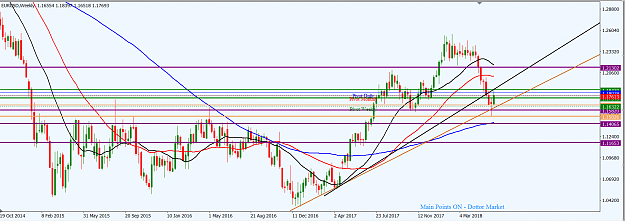
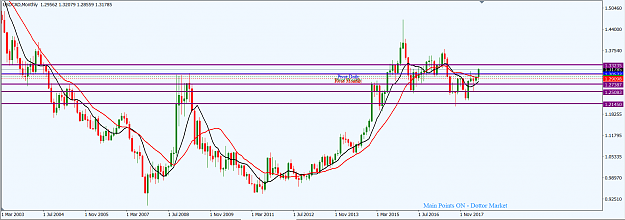
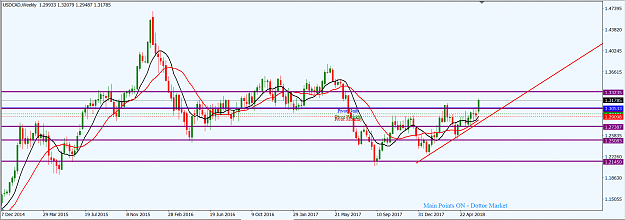
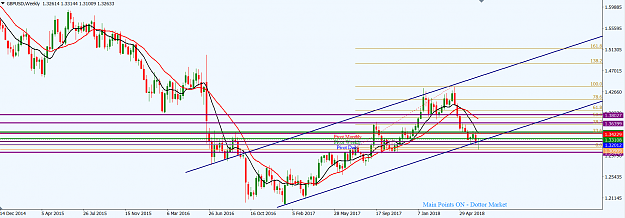
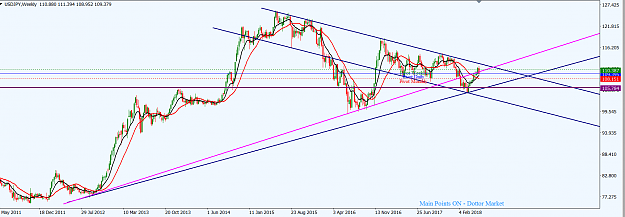
The USDJPY market is still technically bearish. On the weekly time frame, price action is operating at the resistance zone of a falling channel (navy) and within a larger wedge pattern (navy). Last week, a bearish engulfing candlestick was printed which broke below a support trendline (magenta) from the low of September 2012. In actual fact, it was a retest of the trendline earlier broken in February 2018, which is apparently being flipped for a bearish continuation. If bears are able to breach the monthly pivot (108.150) southward, the horizontal support (purple) around the 105.780 may be exposed.
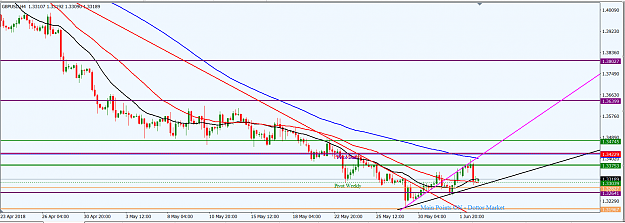
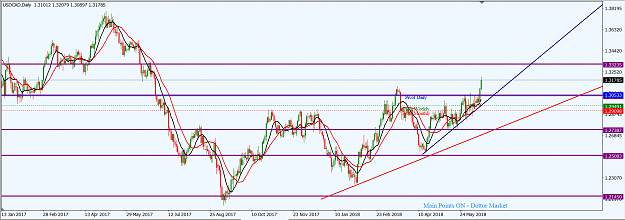
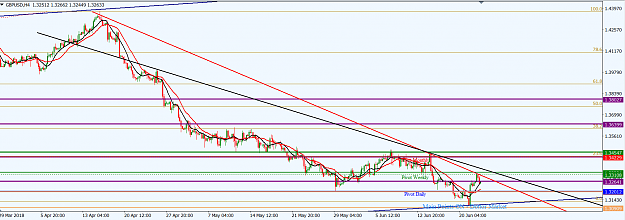
The H4 time frame shows that price action has breached a support trendline (red) after a 78.6 Fib retracement of the drop from the high of January 8, 2018 to the low of March 23, 2018. A resistance trendline (black) is in play and its retesting by price action may validate it for a southward momentum.
I may be wrong. Trade safe and prosper.
KP
The USDJPY market is still technically bearish. On the weekly time frame, price action is operating at the resistance zone of a falling channel (navy) and within a larger wedge pattern (navy). Last week, a bearish engulfing candlestick was printed which broke below a support trendline (magenta) from the low of September 2012. In actual fact, it was a retest of the trendline earlier broken in February 2018, which is apparently being flipped for a bearish continuation. If bears are able to breach the monthly pivot (108.150) southward, the horizontal support (purple) around the 105.780 may be exposed.
Attached Image (click to enlarge)
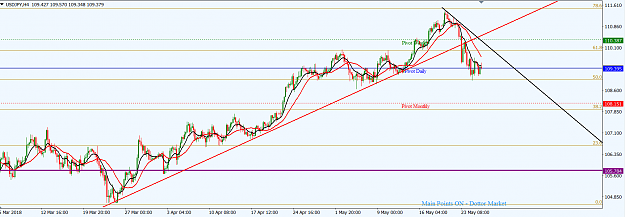
The H4 time frame shows that price action has breached a support trendline (red) after a 78.6 Fib retracement of the drop from the high of January 8, 2018 to the low of March 23, 2018. A resistance trendline (black) is in play and its retesting by price action may validate it for a southward momentum.
Attached Image (click to enlarge)
I may be wrong. Trade safe and prosper.
KP
Do your homework, follow the footprints of smart money