{quote} Now what!! Before you assume its a reversal.. please note that trends dont change directions instantly... you will have lots of Yo-Yo before it empties your account and resume. Dont believe patterns in a correction of a trend... it will be always extended corrections xyz and form complex shapes... better to aim small till the trend is clear. Best of luck
Ignored
lots of yo-yo.... with last day of monthly closing... they want to reduce loses as much as they can. They will attempt to close higher near 1.3330
statistically, we have 75% chance to close higher in june than what we will have today.
{quote} lots of yo-yo.... with last day of monthly closing... they want to reduce loses as much as they can. They will attempt to close higher near 1.3330 statistically, we have 75% chance to close higher in june than what we will have today.
Ignored
From a swing trading point of view, that would be awesome.
Joined Oct 2007
|
Status: Saudi Arabia/Dubai
|3,584 Posts
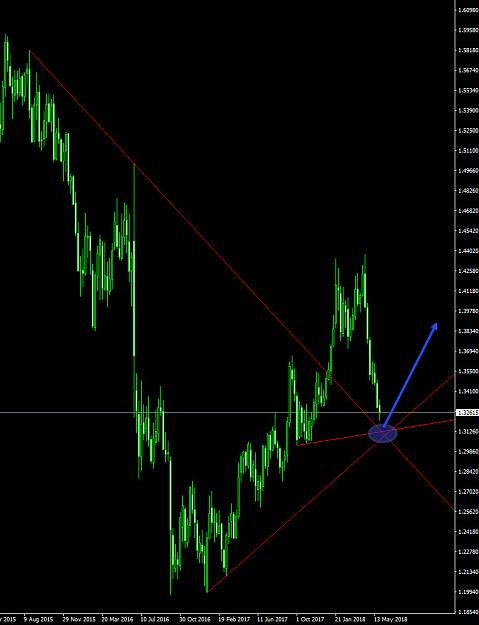
according to Elliott wave rules and conditions GU already filled it to create a bottom and should fly to at least 1.37 but that doesn't mean it cannot one more last leg down to make a tiny lower low
and checking the weekly chart I have found 3 support lines in the range between 1.3090 to 1.3170
I placed huge long position on 1.3170 area and I will hope GU will fall down there before it start flying
I see this being the basis of a short term recovery/retracement. I'm long at 1.3339, looking at 1.3410 as the top of this move.
Ignored
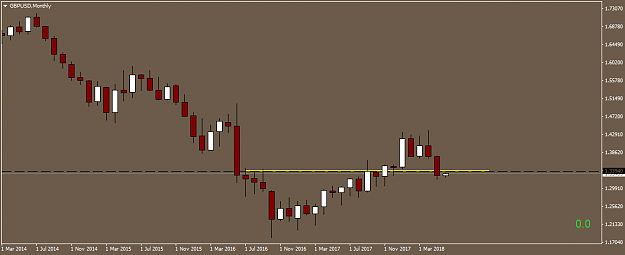
I think you maybe right or thereabouts Luzbay, certainly a better outlook than I have managed to publish this week.
Looking at the monthly, I have a decent reaction zone around that area.
I feel It's always good to acknowledge our mistakes, keeps our feet on the ground and helps us improve.
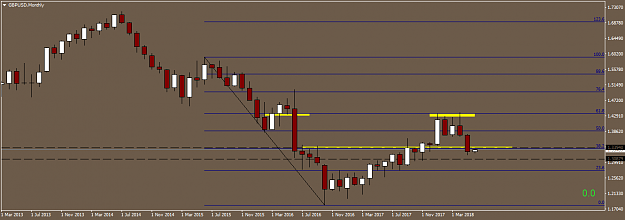
{quote} I think you maybe right or thereabouts Luzbay, certainly a better outlook than I have managed to publish this week. Looking at the monthly, I have a decent reaction zone around that area. I feel It's always good to acknowledge our mistakes, keeps our feet on the ground and helps us improve. {image}
Ignored
All I can tell from this monthly chart is that during the past 2 months price has made a 50% retrace of the previous 15 months.
{quote} All I can tell from this monthly chart is that during the past 2 months price has made a 50% retrace of the previous 15 months.
Ignored
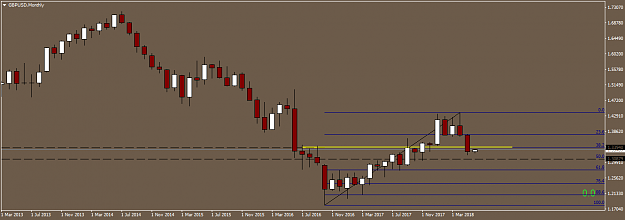
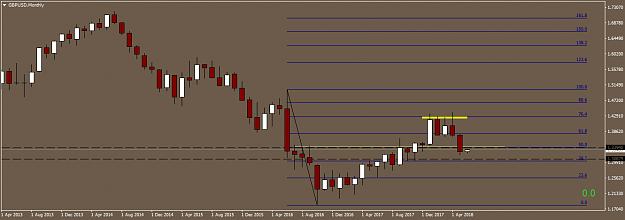
Looking at the monthly PA I highlighted, it looks like a resistance/price reaction area to me. It is also the 38.2fib of the April 2018 high and Oct 2016 low on the chart. You will also find fib confluences in the same area from the other major swing points on the chart, (namely June 2016 high to Oct 2016 low and June 2015 high to Oct 2016 low).
What is the significance of the previous 15 months when it's Oct 2016 that marks the low?
The major 50fib of April 2018/Oct 2016 (I think),comes in around 3090 or so.
{quote} Looking at the monthly PA I highlighted, it looks like a resistance/price reaction area to me. It is also the 38.2fib of the April 2018 high and Oct 2016 low on the chart. You will also find fib confluences in the same area from the other major swing points on the chart, (namely June 2016 high to Oct 2016 low and June 2015 high to Oct 2016 low). What is the significance of the previous 15 months when it's Oct 2016 that marks the low? The major 50fib of April 2018/Oct 2016 (I think),comes in around 3090 or so.
Ignored
Now I'm back at the computer, I can post pictures for clarity.