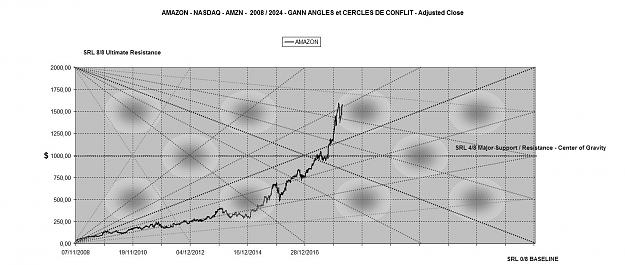
Whatever Price Range can be use to calculate an Octave and divided in 100 ths or 1000 ths
the initial use by Gann was to divide by 8 the price interval between a Top and a Low
the second and latest way was to use precalculated Range 0-1 / 0-10 / 0-100 etc which is more "stable" - you do not have to modify Range and Octave
every time Price Action makes a new Low or a new Top.
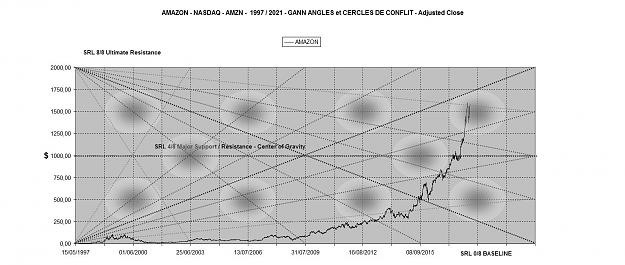
The third way is mine. It is a variant of the second way. It depends on where you draw your Baseline (0/8)
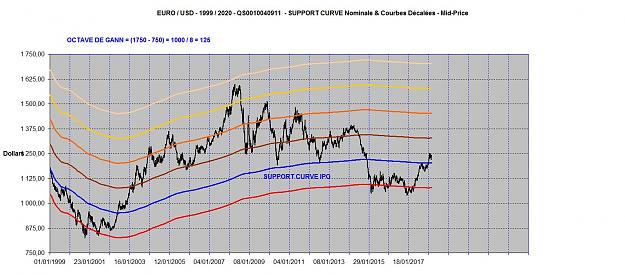
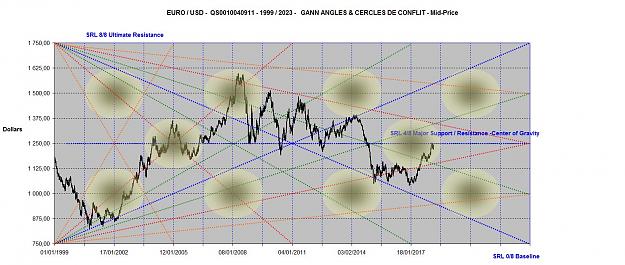
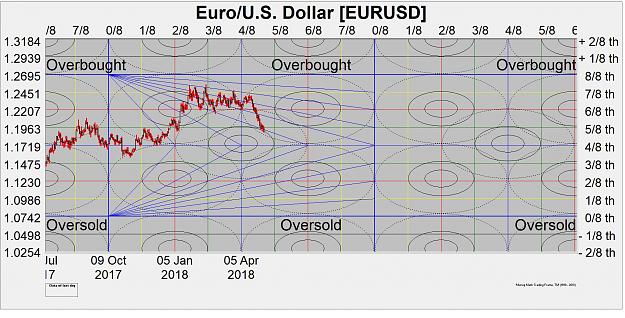
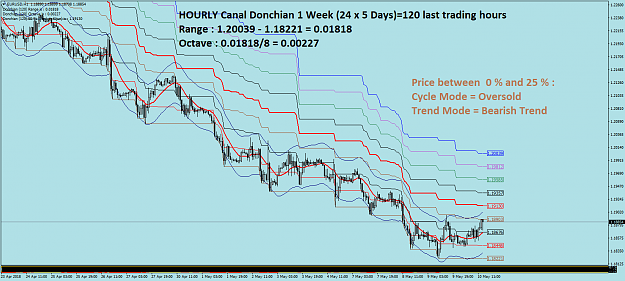
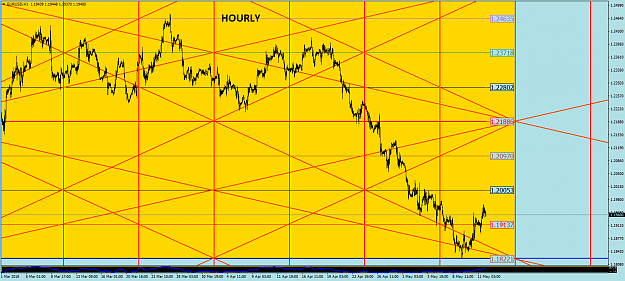
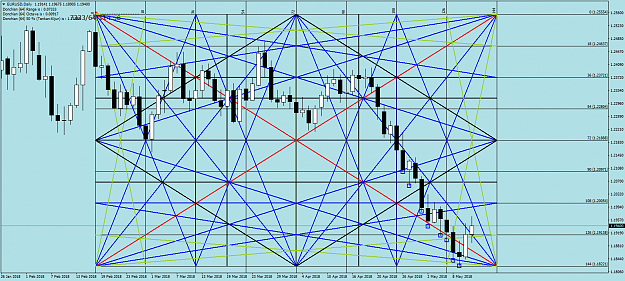
A good example is the EURUSD ;
If you start from zero - Range is 0-2 - Octave = 2 / 8 = 0,25 (and harmonics)
but if you set your Baseline at 0,75 - historical Price Action fluctuates (up to now ) between 0,75 and 1,75.
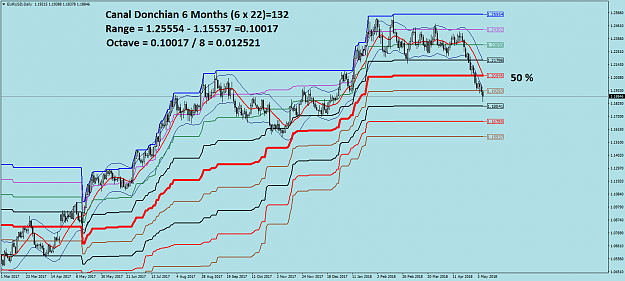
Range is 1,75 - 0, 75 = 1
Octave is 1 / 8 = 0,125
Subharmonics are :
0,0625
0,03125
0,015625
0,007825
0,00390625
etc
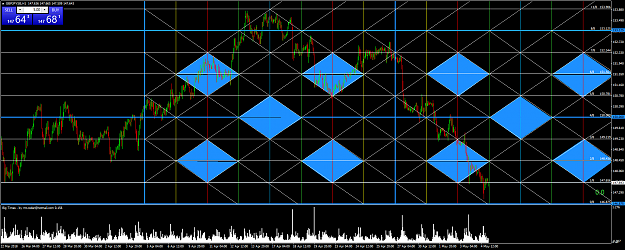
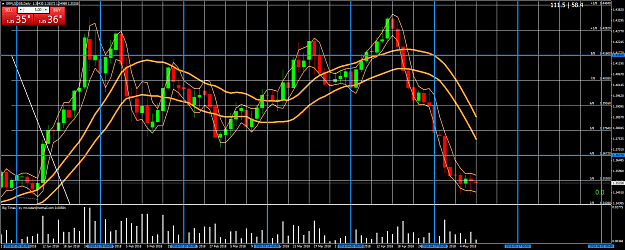
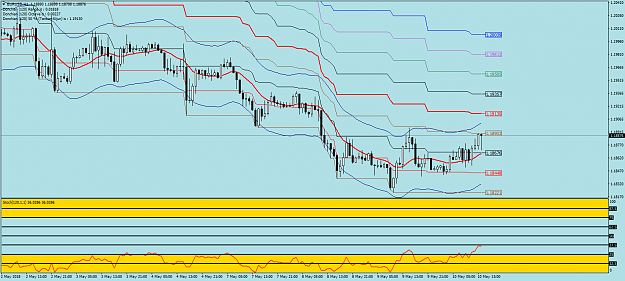
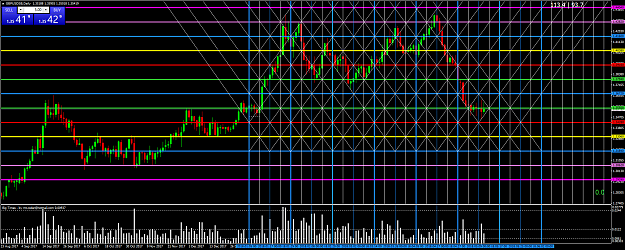
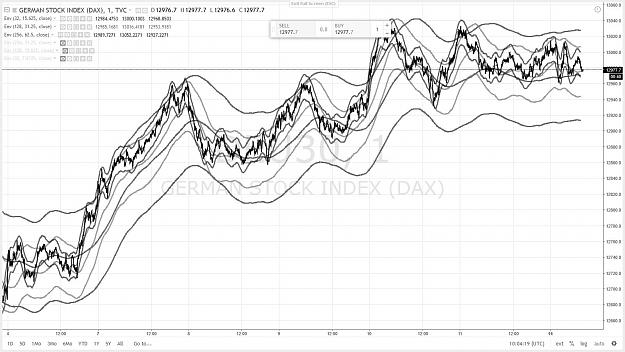
Hi, my friend can i just ask you for your view on this please, i have notice that you now show H/A candles, well right or wrong i think a 2 period high and low m/average shows near enough the same thing with this in mind i have added it to my chart and also a 16 period, think you know were i am leading to with this, any thoughts ?
Hi, my friend can i just ask you for your view on this please, i have notice that you now show H/A candles, well right or wrong i think a 2 period high and low m/average shows near enough the same thing with this in mind i have added it to my chart and also a 16 period, think you know were i am leading to with this, any thoughts ? {image}
Ignored
OAPDave
It is good to try and test. You have to be comfortable with what you do and the method you use.
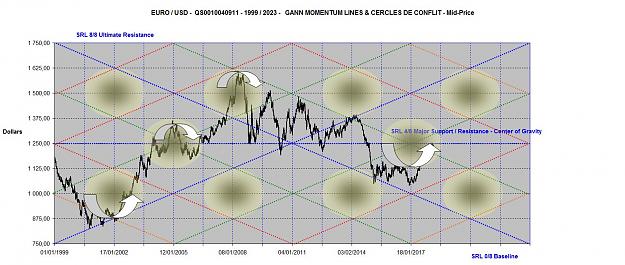
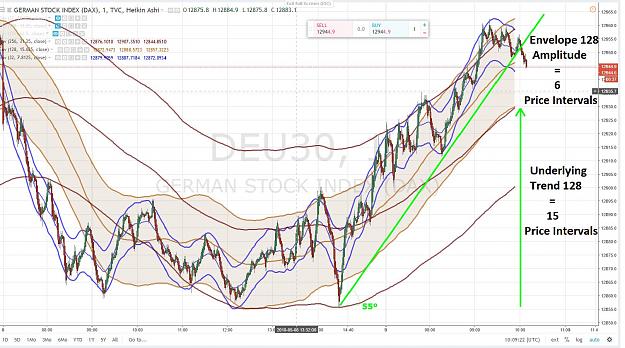
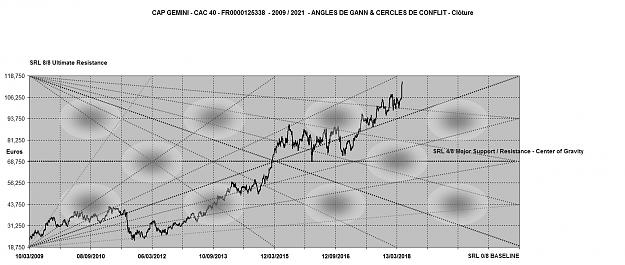
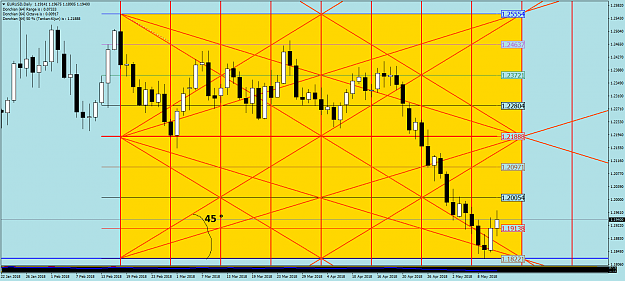
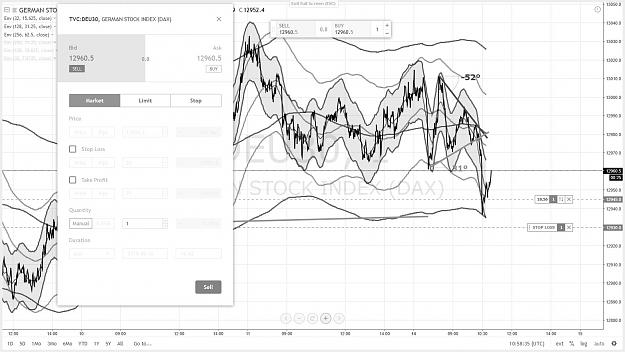
a) the depth / amplitude of the Considered Envelope - here the depth / Amplitude of the Envelope 128 Time Units = 1 Octave
b) the Measured Move from Base to the End point of the Underlying Trend
The Underlying Trend according to Jim Hurst in this case is the Sum of ALL cycles whose periods are greater than 128 Time Units
Here the depth / Amplitude of the Enveloppe 128 = 6 Price Intervals and the Measured Move of the Underlying Trend = 15 Price Intervals
Conclusion : The Influence of the Underlying Trend on the Uptrend was 2,5 times more important than that of the Amplitude of the Envelope 128 Time Units