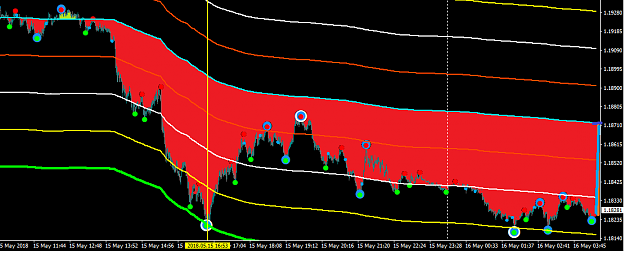
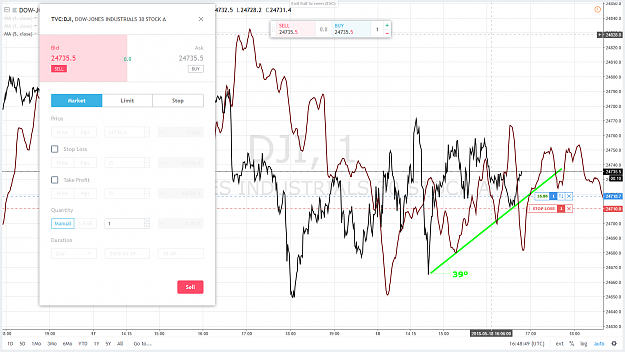
Conversely that is only recently that on M5 EURUSD reches a weak position so in these 3 Timeframes EURUSD is now in a weak position {image}
Ignored
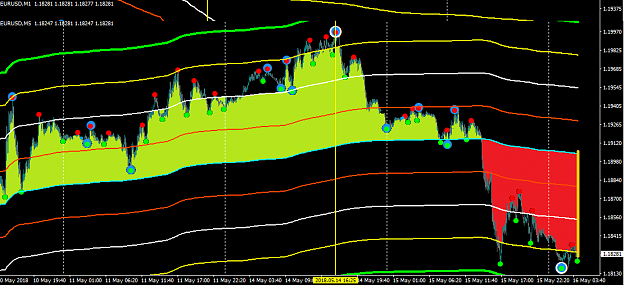
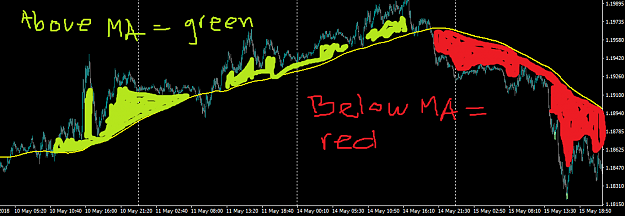
Thanks parisboy, your are right tthat all of them are in a weak position at the moment. Any clue, how do you draw the red and yellow color area on the images ?
edit: any mql programmer idea's is welcome. to make it simple, using MA line is ok (see image below), or any link on how to do it will be also helpful. Thanks
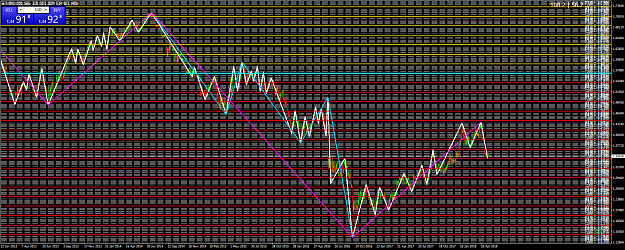
{quote} Thanks parisboy, your are right tthat all of them are in a weak position at the moment. Any clue, how do you draw the red and yellow color area on the images ? edit: any mql programmer idea's is welcome. to make it simple, using MA line is ok (see image below), or any link on how to do it will be also helpful. Thanks {image}
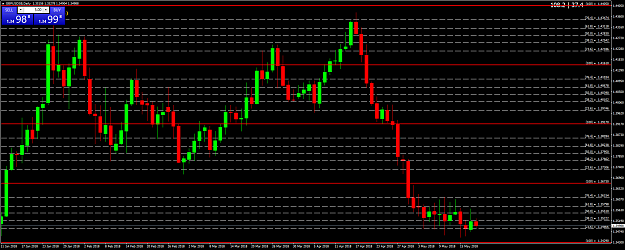
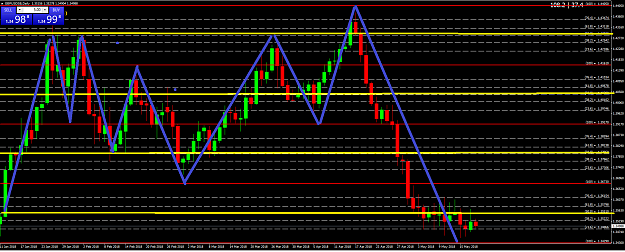
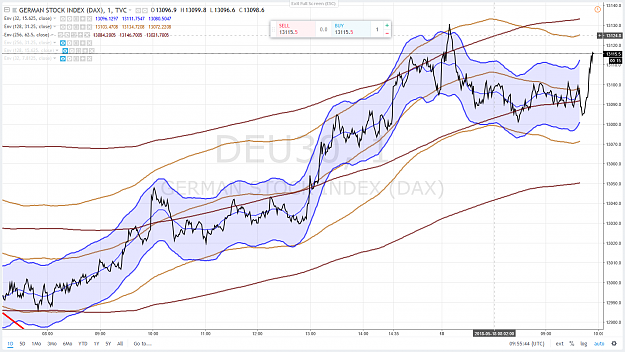
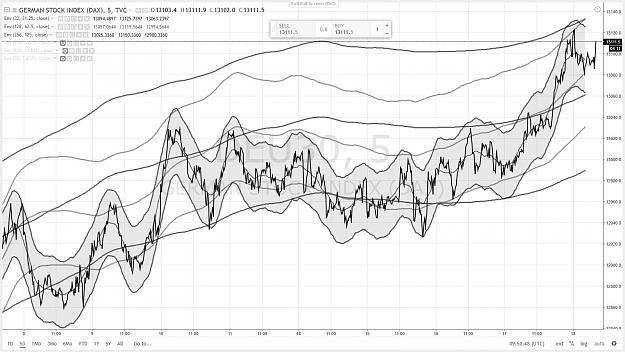
1 base number for all non Yen Pairs and 1 base number for all Yen Pairs add your own trend lines Only need to trade of Daily Time Frame even to scalp ! {image} {image} {image} {image}
Ignored
After 2 nd thoughts it has nothing to do with non yen pairs and Yen pairs
It has to do with : in which Fractal of Price fluctuates pair XY
Most of them fluctuates within the Fractal of Price (Price Range) (0 / 1)
According to the taste and eyes of everyone EURUSD can be seen as fluctuating between Price Range 0-2 or 0,75 - 1, 75 = 1 (see a previous post) ..... which is exactly the same thing
Then if you consider that the correct Price Range to use is 1, Octave is 1 / 8 = 0,125 .... which is the 1 st subharmonic of the previous Fractal of Price / Price Range
All pairs can be connected, that is the robustness and the beauty of the system / methodology
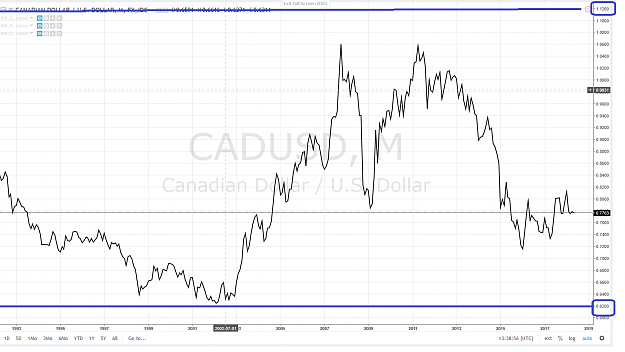
Let's consider the CADUSD !
On the Long Term chart your BASELINE is obviously 0,62 (SRL / MML (0/8) in blue)
Your Fractal of Price Top can be correctly located at 1,12 (SRL / MML (8/8) in blue)
Your Price Range is 1,12 - 0,62 = 0,50
Your Octave is 0,5 / 8 = 0,0625 .... which is the second subharmonic of the Fractal of Price / Price Range (0/2) !
Every pair fluctuation is connected (that is logical) whatever pair you use
There are singularities
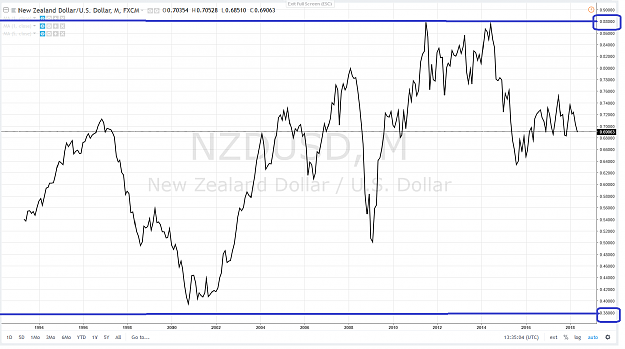
CADUSD and NZDUSD have not the same BASELINE (0,62 and 0,38), but both pairs fluctuate within the same Price Range of 0,50 and are sensitive to the same Octave of 0,0625
This where we use the Hurst principle of commonality
Hmmmmmmmmmmmmm, I can see why the Brexit talks are taking so looooooooong It's very enlightening for me to try to understand your replies they are always so detailed, sorry i used the wrong terminology when i said Baseline i suppose it should be Reference line because when i set it there the indicator produces so many gaps both up and down from there hence i do not have to keep recalculating, really enjoy the banter my friend
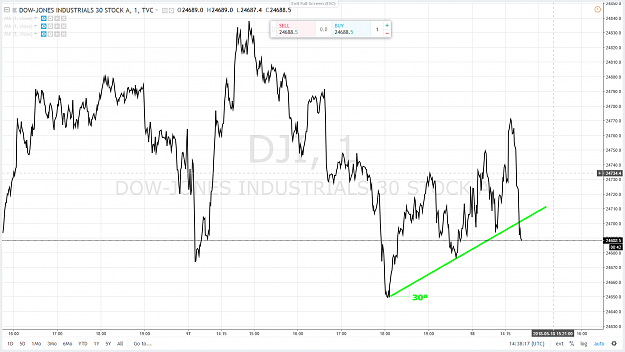
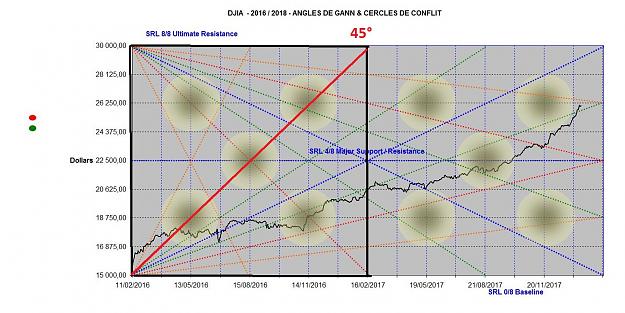
It is not stupid to link the Dow Jones and the US Dollar
Everything is connected
Beauty and robustness of the system / methodology - you use (memorize) the same numbers and you just have to move the decimals on the right or the left.
My 2 cents advice : learn to divide or multiply by 2 ! You will be rewarded !
every body can notice that the "operative" Price Range of GBPUSD on a Long Term basis - here 1994 / 2018 - is 1 = 2,20 - 1,20 The Vibration / Octave is 1 /8 = 0,125 ...
Ignored
Hi parisboy,
I still do not understand why you take 2,20 and 1,20 in this example. If we take 2,15 and 1,15 (which will give us the same range), i think it is more centered ... Will the result by using 2,2 and 1,2 better than using 2,15 and 1,15 ?? or any other reason ... ?
{quote} Hi parisboy, I still do not understand why you take 2,20 and 1,20 in this example. If we take 2,15 and 1,15 (which will give us the same range), i think it is more centered ... Will the result by using 2,2 and 1,2 better than using 2,15 and 1,15 ?? or any other reason ... ?