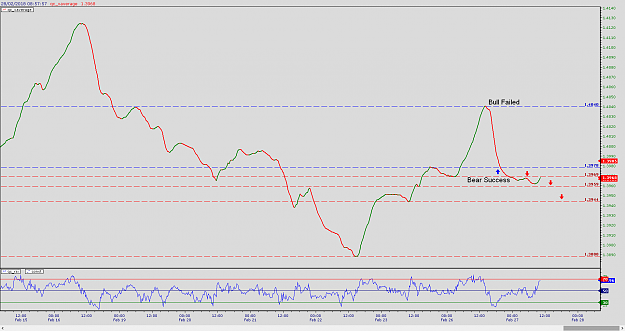
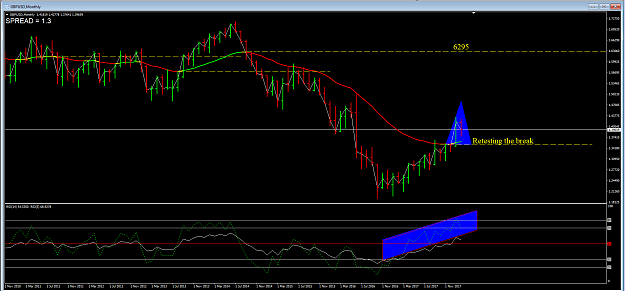
Remember that price leads the average in an attempt to break previous levels and where the failure occurs is where we get our wallets out.
By drawing a horizontal line on these average tops and bottoms we can clearly see what the objective of the price action is.
I cannot for the life of me understand why people cannot see this. It tells you the current trending direction and what price has to do to get there. All we have to do is await the failure points to catch the counter moves. We can set our TP's at these levels even without looking at the price in the form of bars, candles or whatever.
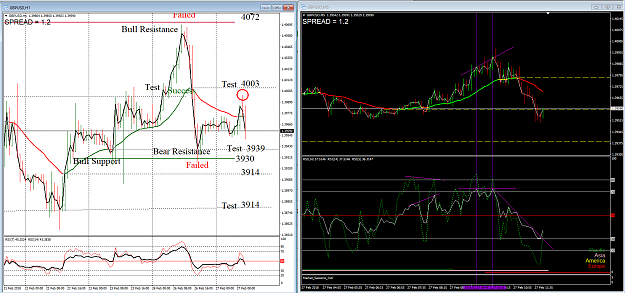
These averages are fractal so you can trade any chart relative to its time. Count the bars on the monthly chart and you will see you have to wait a long time to make a few quid, the lot size has to be small because the stops are huge.
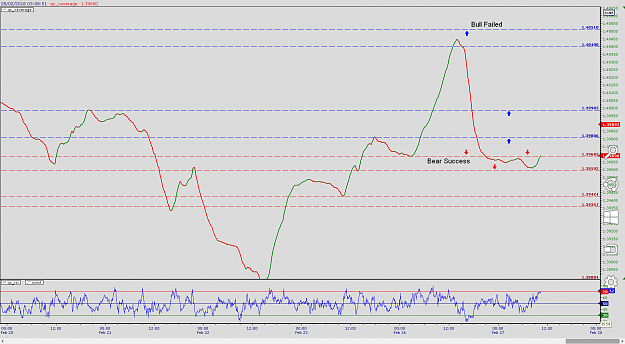
By drawing a horizontal line on these average tops and bottoms we can clearly see what the objective of the price action is.
I cannot for the life of me understand why people cannot see this. It tells you the current trending direction and what price has to do to get there. All we have to do is await the failure points to catch the counter moves. We can set our TP's at these levels even without looking at the price in the form of bars, candles or whatever.
These averages are fractal so you can trade any chart relative to its time. Count the bars on the monthly chart and you will see you have to wait a long time to make a few quid, the lot size has to be small because the stops are huge.
Attached Image (click to enlarge)
3