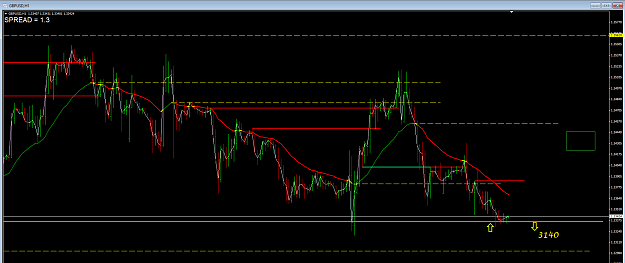
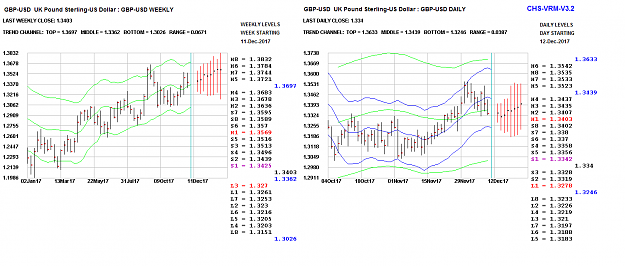
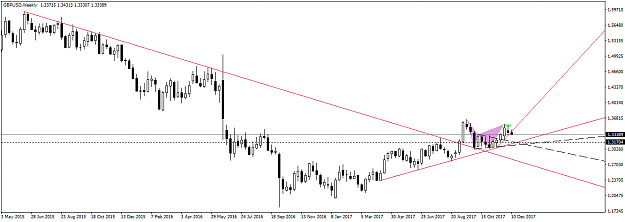
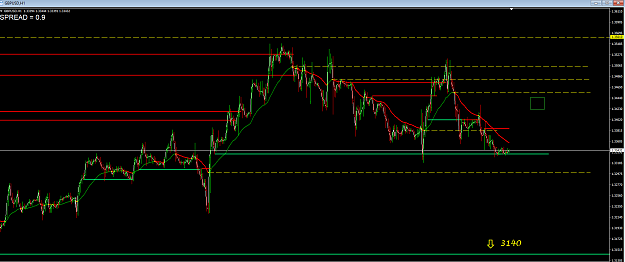
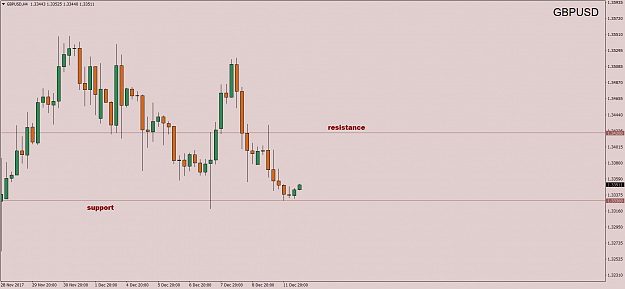
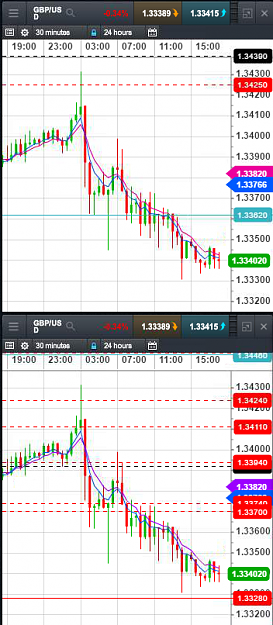
Yesterday I posted Volatility Response Model (VRM) predictions for weekly and daily support levels for GBPUSD in post #456882. Here are the 30 minute mid-value charts of the results. All times are GMT-4. Top chart shows the weekly predicted levels. Bottom chart shows the daily predicted levels. The GBPUSD started the week bearish below all the VRM sentiment levels especially the weekly level 1.3425. The market took about 8 hours to break through the weekly VRM level 1.3362. And finally fell to the daily VRM level at 1.3328. To find out more about the Volatility Response Model (VRM) see the attached document. Predictions for 12 December to follow in next post.
Attached Image (click to enlarge)
Attached File(s)
1
1