Here's a top-down technical analysis on GBPUSD.
On the weekly time frame, two impulse price waves have been formed with corresponding corrective waves. Presently, price action is riding the second corrective wave in an ascending channel formation (bound in blue coloured lines). We should note that price action is respecting a resistance trendline (chocolate colour) from the high of July 2014. Although the most recent price action has spiked above the resistance trendline, it coiuld not breach it as bears restrained the move. This led to the formation of an indecision candlestick last week. The corrective channel (blue colour) is still in play but the most recent price action has been limited to the lower half of the channel (mid-line coloured in red). We may expect a southward move which could retest channel support and may breach it to target the immediate horizontal support around the 1.29460 area. Alternatively, price action may dispose northward to retest the mid-line or the immediate resistance around 1.35750 area.
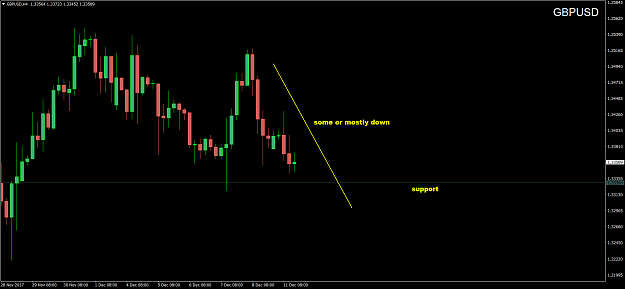
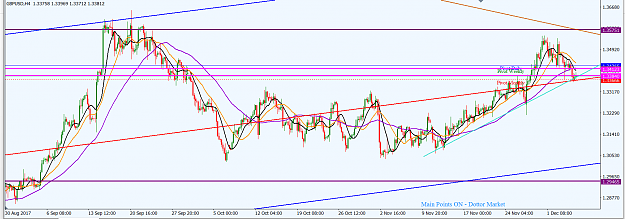
On the H4 time frame, price action has surged southward into a significant S/R zone. This zone has a confluence of support: the mid-line (red colour) of the channel seen on the weekly time frame, the monthly central pivot, a previous demand level and an ascending trendline (turquoise colour) from the low of November 13, 2017. We may expect price action to operate sideways within the zone before further southward move materializes. Should price action break below this zone, bears are likely to target the immediate major horizontal support around the 1.29460 area. Technically, this seems to be a more likely scenario than the alternative of bulls taking price much further up, although we may see a little pullback because of the immediate hurdles bears have to handle around the current location of price action.
I may be wrong. Trade safe and prosper.
KP
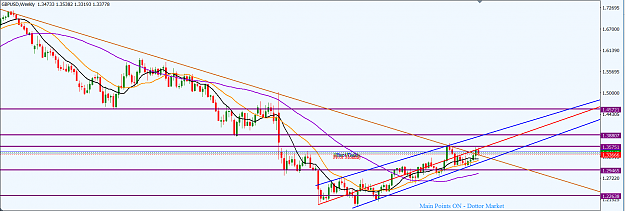
On the weekly time frame, two impulse price waves have been formed with corresponding corrective waves. Presently, price action is riding the second corrective wave in an ascending channel formation (bound in blue coloured lines). We should note that price action is respecting a resistance trendline (chocolate colour) from the high of July 2014. Although the most recent price action has spiked above the resistance trendline, it coiuld not breach it as bears restrained the move. This led to the formation of an indecision candlestick last week. The corrective channel (blue colour) is still in play but the most recent price action has been limited to the lower half of the channel (mid-line coloured in red). We may expect a southward move which could retest channel support and may breach it to target the immediate horizontal support around the 1.29460 area. Alternatively, price action may dispose northward to retest the mid-line or the immediate resistance around 1.35750 area.
On the H4 time frame, price action has surged southward into a significant S/R zone. This zone has a confluence of support: the mid-line (red colour) of the channel seen on the weekly time frame, the monthly central pivot, a previous demand level and an ascending trendline (turquoise colour) from the low of November 13, 2017. We may expect price action to operate sideways within the zone before further southward move materializes. Should price action break below this zone, bears are likely to target the immediate major horizontal support around the 1.29460 area. Technically, this seems to be a more likely scenario than the alternative of bulls taking price much further up, although we may see a little pullback because of the immediate hurdles bears have to handle around the current location of price action.
I may be wrong. Trade safe and prosper.
KP
Attached Image (click to enlarge)
Attached Image (click to enlarge)
Do your homework, follow the footprints of smart money