Dislikedthanks for this great indii'd like to find my TRADE ENTRY using CSM.
Ignored
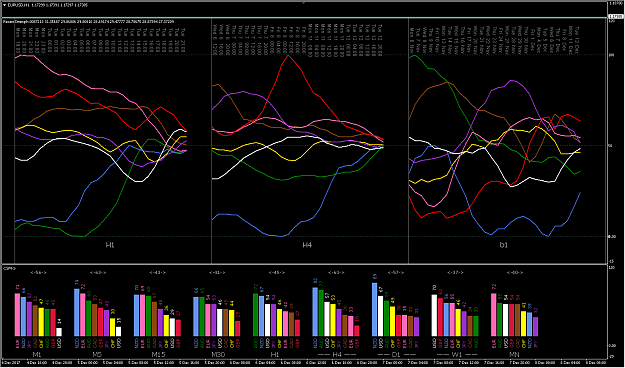
QuoteDislikedwould you help me through(1) i would cross check both TF 4H & TF 15M (2) then wait for a pair to align as strongest & weakest. the pair must be identical in both TF 4H & 15M as the strongest & weakest. (3) when the strongest moves above 80 (average) and the weakest moves below 20 (average) in both TF 4H & 15M, then i make the TRADE ENTRY. am i doing this the right way ?
If you want to pair strength/weakness across two TFs, then IMHO you need to find your own answers to questions like why H4/M15 and not D1/H1, for example. You would also need to decide how your strategy will handle a variety of elements like high impact news, weekend gaps, any special rules for different sessions/times of day, your exit rules, how you will manage risk, etc etc. For more info on system development, you could read a post (for example) like this one as a starting point.
I'm slowly developing my own approach to trading. As opposed to a 'system', it involves the use of several different concepts, and is extremely complex (I disagree with the 'keep it simple' principle). I'm not looking to experiment with new TA-based ideas, or collaborate with anybody who is predominantly TA-focused, at this point.
1