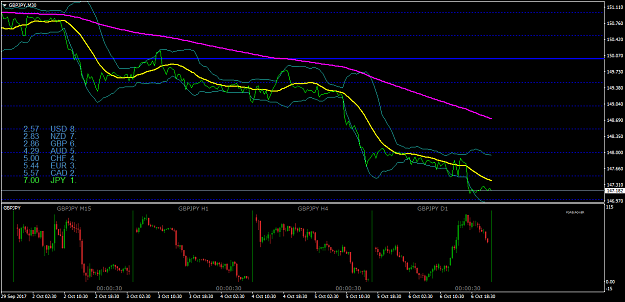
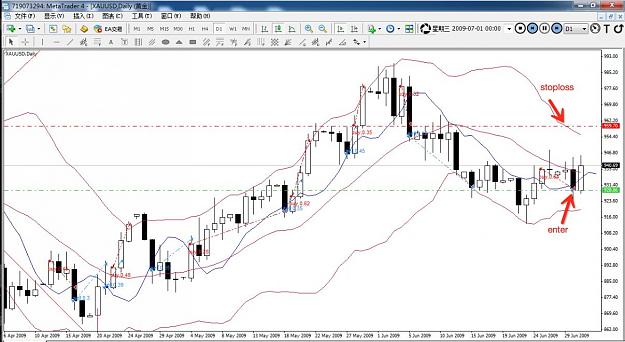
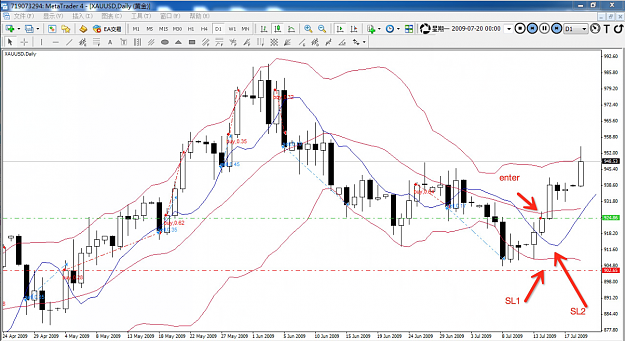
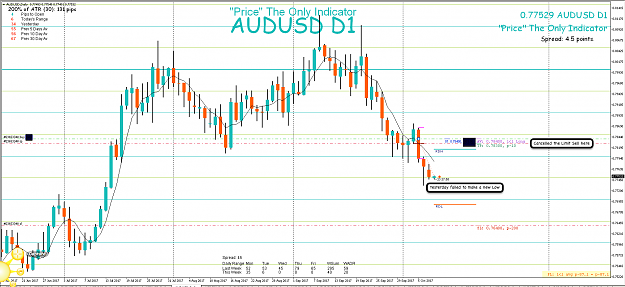
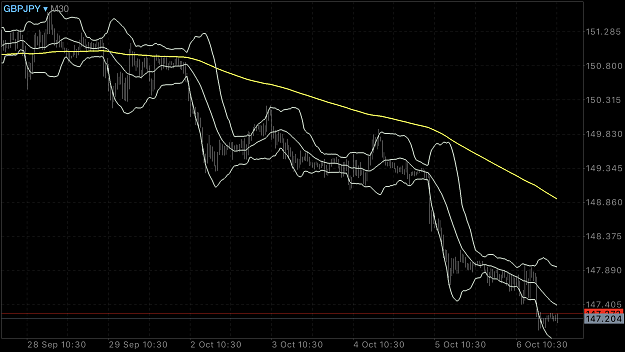
DislikedGuys I'm trying to come up with an indi that highlights "smart money" liquidity hunts/accumalation phases such as highlighted on the chart (below). Might be useful don't you think? Also does anyone know of an indi that places the daily (higher time frame chart) within a lower time frame chart window? Say I've got he 1 hr chart open, I want to see the daily chart at the same time. Would be very useful. {image}Ignored
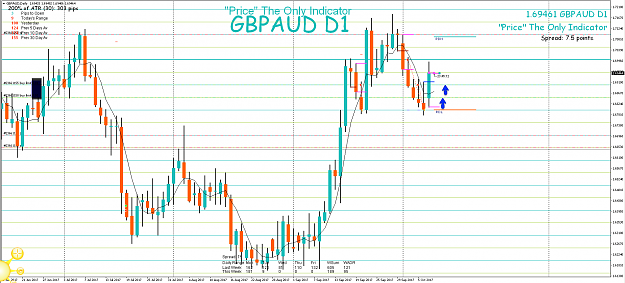
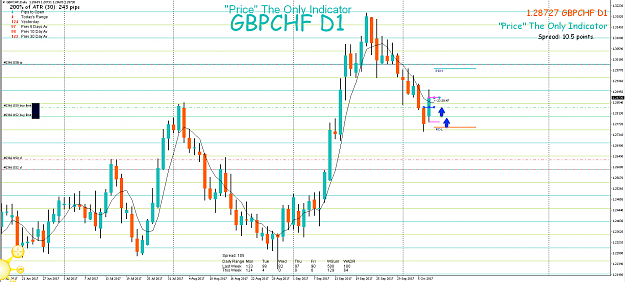
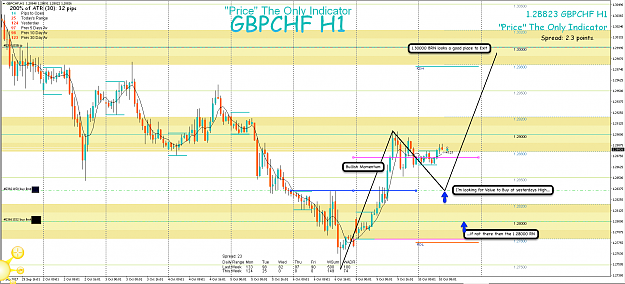
Maybe not the most accurate way to solve it but you can get a good approximation of the dailly SMA5 multiplying the number of x minutes segments per day by 5 (like you have probably done) it should give workable results like here below using EMA240.
Attached Image (click to enlarge)
I used to be indecisive but now I'm not so sure...