Disliked{quote} Put these in the scripts folder and drag onto the screen when you want to put a trade on. {file} {file}Ignored
FOUND THEM!
Trading Made Simple 146,176 replies
Trading Made Simple the right way, and other trading lessons 333 replies
Indicators for the 'Trading Made Simple' system 343 replies
MTF Indicators for the 'Trading Made Simple' system 241 replies
Trading Made Simple system follower - Thanks to eelfranz 9 replies
Disliked{quote} Put these in the scripts folder and drag onto the screen when you want to put a trade on. {file} {file}Ignored
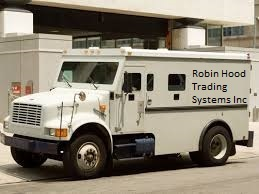
Disliked{quote} Hey DrDave, look what just pulled up outside
Attached Image Ignored
DislikedEG.... just came home and scanned the charts. looks like a neat continuation setup !? Though a little late to the party, I assume !? I like that it's with the main trend on H4, daily and weekly. {image} {image}Ignored
Disliked{quote} Yeah a bit late for that, saw that setup on the confirmation candle, but didn't take it because I saw some divergence on the RSI and RMI, so preferred to let that one go. BTW regarding your chart, don't you prefer to have the TMMS indi provided in this thread, that gives a more visual representation of the 3 oscillators? Like on yours it's not easily distinguishable when one of the 3 has crossed the median line when it's quite close.Ignored
DislikedEG.... just came home and scanned the charts. looks like a neat continuation setup !? Though a little late to the party, I assume !? I like that it's with the main trend on H4, daily and weekly. {image} {image}Ignored
DislikedThe EURJPY looks like it might set up at the start of the next candle. This pair has kicked my ass today though, so I'm not sure I want to tangle with it again{image}
Ignored
Disliked{image} also if the bars turns red without closing. do i exit the trade? Cause what i understand is to enter the trade after the bar closes but how about exiting?Ignored
Disliked{quote} as usual very little will happen after the European markets are closed and NY afternoon session is 'boring'. TMSr does not have Bollinger Band BB in the method but you have BB(20,2) on your chart, right? today your 'ass got kicked' because the volatility is narrow range as the BB shows. If you want ot use the BB set it to (20,1) instead and that is one good volatility filter you can consider to use. if you change your BB(20,2) to BB(20,1) and post your chart again, I will explain how I use the BB(20,1) in my trade planning.Ignored
DislikedTrading Made Simple(r) I have named this thread as such because I learned so much from "Big E's" thread ...Ignored
Disliked{quote} Wow! I thought this was the old Trading Made Simple thread with a new Admin... Awesome! Anyway, I replaced the TDI with this variation that I made called... TDZ {image}Ignored
