A Project Lookin' Glass by v2v
Unlock the full potential of your trading strategy with the v2v dynamic trading system, designed exclusively for the MT4 platform. This revolutionary tool sets itself apart from typical trigger alerts and directional arrows.
This system is designed to enhance your analytical skills and promote a well-informed approach to trading. By encouraging a deeper engagement with market trends and dynamics, the v2v dynamic trading system fosters critical thinking and helps you avoid impulsive decisions. Experience a transformation in your trading journey as you develop a strategic mindset and confidently seize profitable opportunities.
To download the full system directly, click ► HERE, or continue reading below to learn more.
The v2v dynamic trading system offers a unique, dynamic learning experience, providing a refreshing twist from the traditional ' read-the-manual-front-to-back' approach. Instead of simply consuming pre-packaged information, users are encouraged to dive in and discover the system's capabilities, honing their trading skills in a hands-on, self-directed manner. The ultimate goal is to foster an agile, innovative mindset that can thrive in the ever-changing world of modern trading.
And now...
“ Take a deep breath, relax, and allow yourself to envision the Market Makers as mere illusions, no more threatening than a virtual assailant in the Matrix. With this in mind, you'll embark on a journey of self-discovery, guided by the elusive Architect from beyond who holds the sacred knowledge of the Akashic records.
The veil is lifted, revealing an intricate web of market dynamics and nuances. As you navigate the labyrinth of trading possibilities, you begin to forge a personalized neural pathway, customizing your approach to the hidden intricacies of this parallel universe. With the v2v dynamic trading system, you'll discover new insights, leverage powerful tools, and chart your course toward financial enlightenment.
This is a quest, not just for monetary gain, but for a deep understanding of the art (or perhaps science) of trading that will stay with you beyond the confines of time and space.” ─ Agent v2v
That said, be sure to...
QuoteDislikedTrust in the Lord with all of your heart and lean not on your understanding; in all your ways submit to him, and he will make your paths straight
─Proverbs 3:5-6 NIV
The v2v dynamic trading system is a powerful tool for discretionary traders looking to balance a planned strategy with the flexibility to adjust their real-time approach. This system allows traders to effectively monitor their trades and adapt to the ever-changing market conditions. By highlighting potential opportunities, assessing directional probabilities, and assisting traders in navigating the shifting landscape, this system offers the insights necessary for confident, informed decision-making.
Please be aware that the v2v dynamic trading system is still a work in progress and is undergoing continuous refinement and development. I am committed to providing an exceptional tool, and your feedback is essential for improvement. I encourage you to share your suggestions and ideas. While I may not be able to implement all of them, I will consider them as I work to make the v2v dynamic trading system the best it can be.
Navigating the line between reality and illusion, you may find yourself questioning whether you've truly taken the red pill. It seems as though your eyes have opened to a new world where the edges of the Matrix are always changing. You might feel a sense of rebirth, experiencing the thrill of a new digital reality as your perceptions are influenced by the code of the v2v dynamic trading system.
Like Neo, you notice the peculiarities and glitches in this virtual world: a familiar black cat crossing your path, a moment of déjà vu appearing briefly. These are simply signs of a system in transformation, codes being rewritten, and a trading tool evolving and gaining power. At this moment, it feels like anything is possible. Just like Neo, you, too, may discover that you have the potential to bend the rules and break free from the constraints of traditional trading methods. In this environment, in this Matrix of v2v, the only limit is your imagination.
The definition of technologies used inside this system...
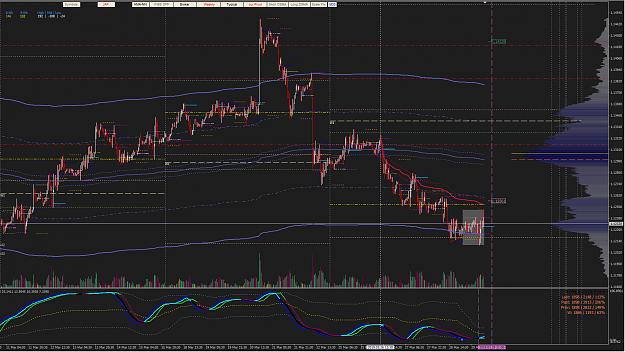
☛ The VWAP bands on this system
Using an average true range/average range or an average daily range, the VWAP bands (shifted from the main line) are calculated with statistical z-scores. The VWAP calculation is primarily based on the lecture by Dr. Paul Levine (R.I.P.) on the MIDAS system.
A statistical z-score value can be injected into an algorithm or included in an equation for predicting trend-end probabilities. The vertical line guides on the chart (from & to) are used for plotting price inflection points or session ranges (4-hour, daily, weekly, and monthly or 8-hour or 24-hour market range). The setup included a feature that can switch from MVWAP (MA-based VWAP ) to classic VWAP. MA (Moving Average) is a non-lag Hull MA calculated using Fulk's Matulich for T3-based MA. As a result, I call it T3-HMA.
As part of the system, linear, volume-weighted MAs are applied (but only some of them, as the rest use adaptive calculations with Price) before adding the DSMA filter (Deviation-Scaled MAs by John F. Ehlers). Then, the MA's period calculation within the system is calculated/assigned dynamically based on the current Dominant Cycle Period.
☛ Dynamic Zones by Leo Zamansky, Ph.D., and David Stendahl
The Dynamic Zone indicator elaborately shows how it solves common trading complications. An oscillator is a valuable technical analysis tool employed in aggressive investment strategies to capitalize on market trends. This approach to investing adheres to a straightforward, logic-based methodology - It only enters the market when an oscillator has moved far above or below traditional trading levels. However, these indicator-driven systems cannot evolve with the market because they use fixed buy and sell zones. Traders typically use one set of buy and sell zones for a bull market and substantially different zones for a bear market.
Herein lie the complications. Once traders begin introducing their market opinions into trading equations, they negate the system's mechanical nature by changing the zones. The objective is to have a system automatically define its buy and sell zones and thereby profitably trade in any market, bull or bear. Dynamic Zones present a dynamic solution to the limitations of fixed buy and sell zones in any indicator-driven system.
☛ Jurik filter ─ phase and smoothing
JMA (Jurik Research Moving Average) phase and smoothing calculation. Have you noticed how moving averages add some lag (delay) to your signals, especially when price gaps are up or down in a substantial move, and you are waiting for your moving average to catch up? Wait no more! JMA eliminates these complications forever and gives you the benefits of both worlds: low lag and smooth lines.
Ideally, for instance, a filtered signal should be smooth and lag-free. Lag causes delays in your trades, and increasing lag in your indicators typically results in lower profits. In other words, latecomers get what's left on the table after the feast has already begun. The JMA's improved timing and smoothness will astound you.
JMA is a powerful adaptive tracker that can smooth time series data with minimal lag, no overshoots, and no oscillations. The algorithm is stable and avoids the complexities of neural networks. JMA delivers the most reliable all-around performance for smoothness, accuracy, and timeliness.
☛ Best Formula: Using Average Price Bar ( APB )
Average Price Bars (APBs) more accurately represent the current market by minimizing fluctuations in nominal price action, often referred to as the “choppiness” of current High, Low, and Close price action. In other words, APBs eliminate the noise of price distortion.
☛ haDelta (Heiken Ashi - Delta)
haDelta is a simple formula originally developed and published by Mr. Dan Valcu. The idea behind haDelta is to quantify HA candles. One can measure momentum, which is very important when you use haDelta for reversals. It measures the difference between haClose and haOpen. Caution: High sensitivity if used.
☛ Uses Hull MA (by Allan Hull), but this one is a variation from Low lag to zero lag.
Various moving averages exist, with the Simple Moving Average (SMA) being the most basic. However, the SMA suffers from a significant lag in price movements. To address this issue, the Exponential and Weighted Moving Averages were introduced, which focus more on recent data for better accuracy. Allan Hull developed the Hull Moving Average (HMA), A remarkably fast and seamless technique that practically eliminates delays while also improving smoothness at the same time. The dynamic MyRSI with NET, combined with T3 Hull MA variation, Jurik filters, and phase & smoothing, ultimately achieves optimal lag elimination for more precise results.
☛ Ehler's Deviation-Scaled Moving Average ( DSMA )
The Deviation-Scaled Moving Average (DSMA) is an innovative data-smoothing technique introduced by John Ehlers in the July 2018 issue of TASC magazine. The DSMA functions as an exponential moving average with a dynamic smoothing coefficient, which adapts based on the magnitude of price changes. By utilizing the standard deviation from the mean to measure this magnitude, the DSMA provides substantial data smoothing, even when price changes are small, while swiftly adapting to these changes. As a result, this indicator offers minimal computational lag and rapid adaptation to price variations, making it an effective tool for identifying trends and potential trading opportunities.
☛ Vertical Horizontal Filter ( VHF )
The Vertical Horizontal Filter (VHF), developed by Adam White, is a valuable tool for identifying trending and ranging markets. Similar to the ADX in the Directional Movement System, the VHF evaluates the degree of trend activity, allowing traders to use trend indicators in trending markets and momentum indicators in ranging markets. By effectively differentiating between these market conditions, the Vertical Horizontal Filter facilitates more accurate and informed decision-making when employing various trading strategies.
☛ Dominant Cycle Period ( DCP )
The DCP-generated value is being used as a dynamic Period parameter value (for dynamic MyNET).
Based on the Homodyne Discriminator by John F. Ehlers, Rocket Science for Traders. This type of algorithm exhibits superior performance in a low signal-to-noise environment.
☛ Linear Momentum ─ a.k.a. MomenTicks
Linear momentum is defined as the product of a system's mass multiplied by its velocity. In symbols, linear momentum is expressed as p = mv. Momentum is directly proportional to the object's mass and velocity. Thus, the greater an object's mass or the greater its velocity, the greater its momentum.
☛ My NET ( Noise Elimination Technology )
As a technical indicator, MyNET employs Kendall correlation to eliminate nonlinear noise. However, the application of additional filters in this system results in a significantly less noisy plot than RSI.
The NET is a modified version of the RocketRSI Relative Strength Index. A one-bar close price difference is calculated as the ratio between their absolute values and the sum of the recent one-bar close price differences.
☛ Elegant Osci
In a unique update for dynamic MyNET with the SmoothStep function, "An Elegant Oscillator: Inverse Fisher Transform Redux," author John Ehlers (At TASC Magazine article - February 2022) explains how he uses the inverse Fisher transform to create an indicator he calls the elegant oscillator.
First, he describes the Fisher transform before explaining the inverse Fisher transform, which provides normalization by dividing the root mean square (RMS) value into the waveform.
The elegant oscillator can spot reversion-to-the-mean opportunities with improved timing capabilities.
☛ Momentum Deviation
This is another variation of a standard deviation, as it is embedded with the dynamic MyNET
- It uses the momentum of price (instead of price itself) for calculation
- It is calculated in a way that it takes minimal CPU load
- As far as values are concerned, it is similar to standard deviation. It is the same as a standard deviation -it can calculate the deviation of anything.
☛ The ADX
ADX is a popular indicator whose elaborated form is the Average Directional Movement. Traders rely on this indicator to assess the strength of the trend. However, using the traditional ADX requires a perfect understanding of the highs and lows of the market. To make things easier, the developers have created the ADXm Indicator.
dynamic MyNET uses the ADXm algorithm.
☛ The Linear Regression-adjusted Quantitative Qualitative Estimation double
TASC magazine's August 2022 issue featured another variant of a moving average called “The Linear Regression-Adjusted Exponential Moving Average." Author Vitali Apirine presents a technique called the linear regression-adjusted exponential moving average (LRAdj EMA) to combine a linear regression indicator with an EMA. The indicator can be used to help define turning points while filtering price movement. The LRAdj EMA can be applied in combination with a traditional exponential moving average of the same length to facilitate trend identification.
☛ Hurst Exponent with NET (a variation) - inside dynamic MyNET
In the 1970s, an American engineer called JM Hurst published a theory about why financial markets move in the way they do. The theory was the result of many years of research on powerful mainframe computers, and it became known as Hurst’s Cyclic Theory. Hurst claimed a 90% success rate in trading based on his theory, and yet the theory has remained largely undiscovered and often misunderstood.
The Hurst Exponent is used as a measure of the long-term memory of a time series. It relates to the autocorrelations of the time series and the rate at which these decrease as the lag between pairs of values increases. Studies involving the Hurst exponent were originally developed in hydrology for the practical matter of determining optimum dam sizing for the Nile River's volatile rain and drought conditions that had been observed over a long period. The name "Hurst exponent," or "Hurst coefficient," derives from Harold Edwin Hurst (1880 - 1978), who was the lead researcher in these studies; the use of the standard notation H for the coefficient also relates to his name.
The Hurst exponent is referred to as the "index of dependence" or "index of long-range dependence." It quantifies the relative tendency of a time series either to regress strongly to the mean or to cluster in a direction.
A value of H in the range 0.5 - 1 indicates a time series with long-term positive autocorrelation, meaning that a high value in the series will probably be followed by another high value and that the values a long time into the future will also tend to be high.
A value of H in the range of 0 to 0.5 indicates that a time series exhibits long-term switching between high and low values in adjacent pairs. This means that a high value is likely to be followed by a low value, and the value after that is expected to be high, with this pattern of switching between high and low values persisting for a long time.
A value of H = 0.5 can indicate a completely uncorrelated series, but it is the value applicable to series for which the autocorrelations at short time lags can be positive or negative, but where the absolute values of the autocorrelations decay exponentially quickly to zero. This is in contrast to the typical power-law decay for the 0.5 < H < 1 and 0 < H < 0.5 cases.
Hurst exponent estimation is a viable tool for analyzing the past. Looking at a correctly estimated H value can answer the following question: Was the market persistent, or was it anti-persistent? In turn, that would help you analyze the performance of your trading strategy or expert advisor during that particular period.
YouTube video about Hurst Trading
Note to Self: “While no methodology or system works in every instance . . . I have never seen anything so consistent” ─ just like this system ; )─
No guarantees are provided as to the accuracy, completeness, timeliness, suitability, or accuracy of any information - such as indicators, videos, images, and charts - posted or shared here. The contents I posted here at ForexFactory (FF) are subject to modification (bound by FF and thread owner's rules and restrictions) and may have become unreliable due to a variety of factors, including changes in market conditions or economic factors.
It is important to recognize that trading inherently involves a degree of risk, and individual outcomes may vary. Past performance and personal experiences should not be viewed as indicative of future results. To evaluate the suitability of any investment strategy, product, or service discussed here, it is advisable to consult with a qualified investment professional who can assess your unique circumstances. Please be aware that all investments carry risks, including the potential loss of principal.
The primary intention behind sharing this information is not to gain a following or subscribers but rather to contribute to the broader trading community and maintain an online record of this system's development. Furthermore, I would like to clarify that I do not have ADHD.
Before using the v2v dynamic trading system (templates), please review the following information:
Loading Historical Data (New STEPS to follow)
If you are a new user or have recently opened an account with your trusted broker, follow these steps (refer to the screenshots below):
- Go to the History Center: Tools menu > History Center
- Run the script: LoadHistory_M1-data_OnlyAttached Image (click to enlarge)
Attached Image (click to enlarge)
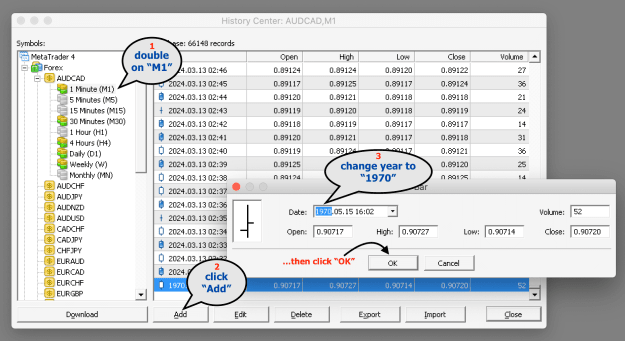
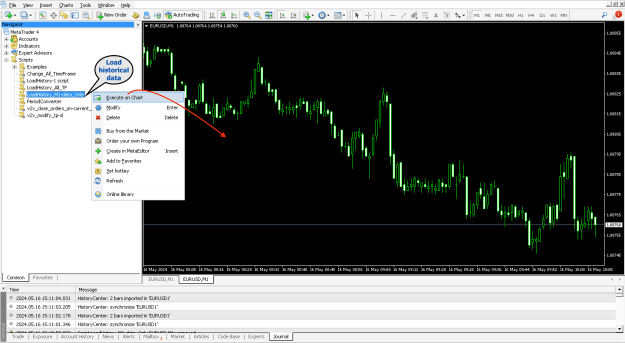
After the process is complete, your MT4 chart will be filled with an additional number of bars ranging between 2048 and 65536 M1 bars. These bars are directly sourced from your broker's server (not Metaquotes). This imported data usually exceeds the amount that can be retrieved normally, providing the v2v dynamic trading system with a more extensive historical tick dataset for analysis.
- Afterward, delete any dummy tick data from 1970 to maintain accuracy. If you haven't obtained the maximum historical data post-deletion, re-add the 1970 record temporarily and repeat the process.
- This approach efficiently acquires maximum M1 data for your selected currency pair. Proceed to download data for other timeframes as needed.
Important Notes:
- The v2v dynamic trading system uses M1 historical tick data by default. Load other TF data using the same steps.
- The system requires a comprehensive tick data history, so it should scale with the MT4 platform.
- As the platform gathers data, error messages ("not enough tick data to calculate," "data horizon breach," and "array out of range") should no longer appear in the Expert logs.
The v2v dynamic trading system is a powerful tool, but its effectiveness depends on the user's skill. To fully leverage this system, it's essential to educate yourself about both the system and the market. This process requires dedication, research, and a willingness to deepen your understanding. If you encounter obstacles or challenges while using the system, remember that its creator has invested significant effort into its development. Negative criticism, though it may be tempting, often fails to provide constructive feedback and can hinder progress. Instead, it's important to approach the system with an open mind, recognizing the potential for improvement while also appreciating the developer's efforts.
In a world where knowledge is power, the v2v dynamic trading system shines as a beacon of opportunity for those willing to embrace its possibilities. As a community of traders, we must cultivate an environment of learning and improvement, supporting one another and the system's creator in our collective journey to understand the complex dynamics of the markets.
The v2v dynamic trading system is a valuable tool for enhancing your trading strategy, and I am excited to share this knowledge with you. Remember to trade wisely and patiently, and most importantly, never stop learning. The benefits of successful trading go far beyond just financial gains; they also foster a deeper understanding of the markets and ourselves.
✜ v2v dynamic trading system ✜
You can consider trying this v2v dynamic trading system only if your current setup is not yielding a profitable outcome. Otherwise, it's best to move on.
The current release of the v2v dynamic trading system (Winter Time — DST adjusted):
Chart templates:
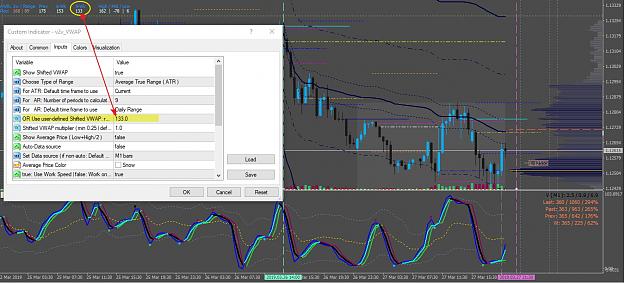
• Once loaded, verify the indicator parameter to check if the recursive calculation is ON or OFF.
• To track market session times, check market24hclock dot com, worldtimebuddy dot com, or herein at ForexFactory.
Operational setup:
For smoother navigation when adjusting your chart screen and settings, consider temporarily disabling certain features, such as dynamic MyNET or Hidden Gap Finder (turn OFF) and v2v top correlation. Reducing the start bar parameter value can also help. This will allow for a more seamless experience when setting stop-loss and take-profit levels, closing existing positions, or making other adjustments. Remember, once done, you can always reactivate these features (turn back to ON).
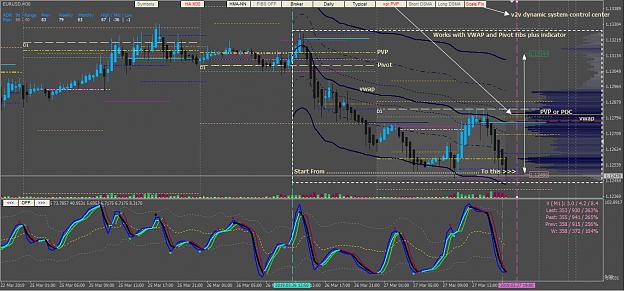
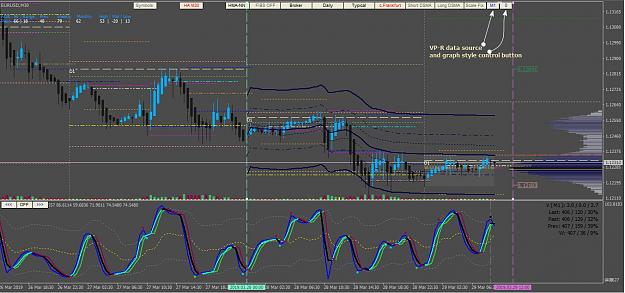
The screenshot below is the updated Look & Feel.

The expert reviews...
❝ His chart... You can tell it's real because it looks so fake, honestly ❞ ; )─ Elon Musk.
❝ The Swiss Army Knife for the MT4 trading platform ❞ ; )─ Chat GPT
"The v2v dynamic trading system comprises a comprehensive collection of tools and indicators that function in tandem. It is crucial not to use them in isolation, as relying on only one or two tools may lead to inaccurate results and subpar trading outcomes."
"The v2v dynamic trading system is designed to promote a more thoughtful and rational approach to trading. It encourages users to enhance their analytical skills and make informed, well-considered decisions. With the system's tools and indicators, users can establish a technical bias based on confluences and setups before the market opens, setting a solid foundation for developing a trading strategy. By customizing the system to their unique preferences, users can harness its full potential, making it an extension of their analytical abilities.
Personalizing the v2v dynamic trading system enhances its effectiveness and fosters greater ownership and responsibility among users. By incorporating their analysis and insights into the system's framework, users gain a better understanding of their strengths and weaknesses as traders. This process encourages a more confident and measured approach to the market, enabling users to anticipate and adapt to the ever-changing dynamics of the financial landscape."
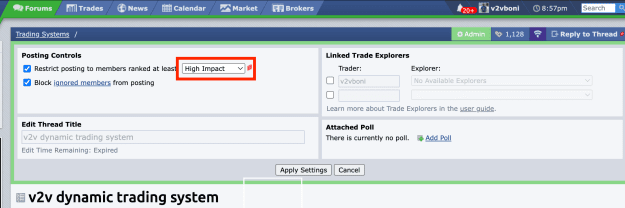
Members who can post in this system development thread: