• Home
  • Forums
  • Trades
  • News
  • Calendar
  • Market
  • Brokers
  • Login
  • Join
  • User/Email: Password:
  • 1:57am
Menu
  • Forums
  • Trades
  • News
  • Calendar
  • Market
  • Brokers
  • Login
  • Join
  • 1:57am
Sister Sites
  • Metals Mine
  • Energy EXCH
  • Crypto Craft

Options

Bookmark Thread

First Page First Unread Last Page Last Post

Print Thread

Similar Threads

Oanda locked my account and they wont tell me why 10 replies

Locked (hedge) trade can face a Margin Call 101 replies

Can someone help please mt4 completely locked up 1 reply

MB Trading: Anyone else get mysteriously locked out? 0 replies

Already locked gains today 2 replies

  • Commercial Content
  • /
  • Reply to Thread
  • Subscribe
  • 97
Attachments: Locked-in Range Analysis (LRA)
Exit Attachments
Tags: Locked-in Range Analysis (LRA)
Cancel

Locked-in Range Analysis (LRA)

  • Last Post
  •  
  • 1 2Page 3456 8
  • 1 2Page 34 8
  •  
  • Post #41
  • Quote
  • Jan 8, 2018 11:57am Jan 8, 2018 11:57am
  •  VEEFX
  • Joined Jun 2006 | Status: Adios! | 3,377 Posts
Quoting t8936
Disliked
{quote} I will try to answer all your questions in order. If you use 10min timeframe or less, there is a lot of "market noise". What does it mean? For example you find the 5 min' support LR (> Sell Open Positions), but the main sentiment (1H & 1D) is Buy or Undefined, so your support LR doesn't have enough imbalance to continue to influence the quotation of the price. This is the right way to find your enter when you are guided by 1 Hour LRA, but you must be prepared for an increased number of errors. Because 5min LRs have a short time of holding...
Ignored
Thanks. I prefer momentum plays and moving SL to BE+x as quickly as possible for either a quick scalp or whatever I can get out of the move. Are you suggesting market makers also manage their exposure on a time series basis? I don't think you are but better to confirm.
Staying in my lane...
 
 
  • Post #42
  • Quote
  • Jan 9, 2018 12:59pm Jan 9, 2018 12:59pm
  •  t8936
  • | Commercial Member | Joined Dec 2017 | 87 Posts
Quoting VEEFX
Disliked
What I mean by this is to trade the bounce off SLTP levels rather than trade breakouts out of a range (as there is no way to predict direction of breakout)
Ignored
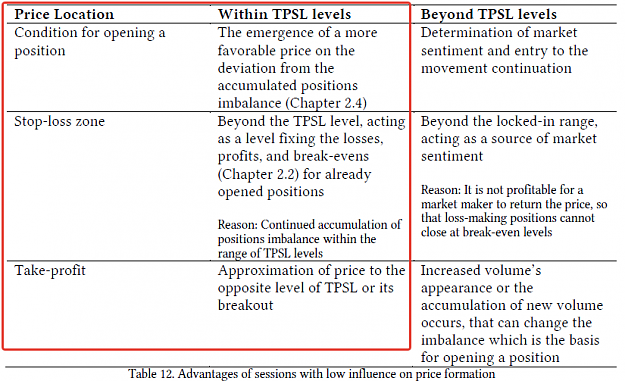
Yeah, LRA let us to trade within TPSL levels. Take a look at the table below from the LRA book.

Attached Image (click to enlarge)
Click to Enlarge

Name: 2018-01-09_21-57-18.png
Size: 50 KB
Don't be a Lucky-trader! Just make cause-and-effect trades!
 
 
  • Post #43
  • Quote
  • Jan 9, 2018 1:24pm Jan 9, 2018 1:24pm
  •  t8936
  • | Commercial Member | Joined Dec 2017 | 87 Posts
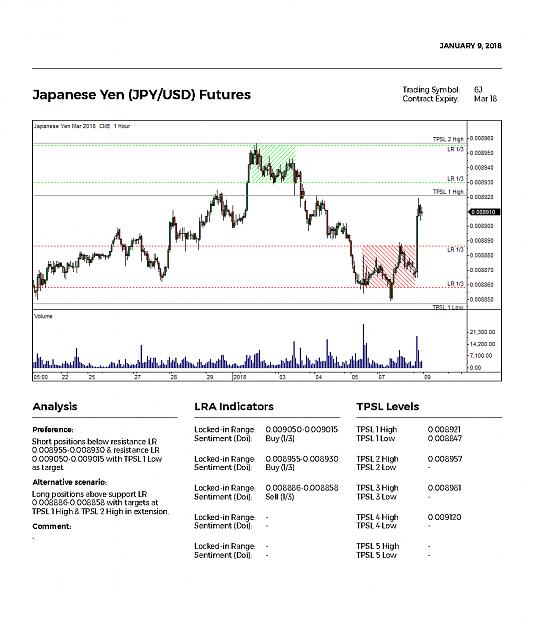
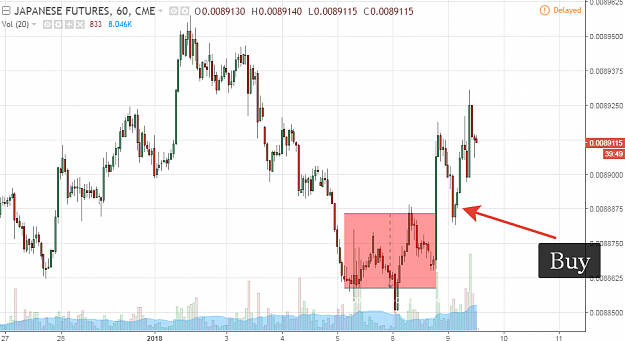
Lets look at today's LRA and how it helps us to make money $$$

Attached Image (click to enlarge)
Click to Enlarge

Name: 2018-01-09-.jpg
Size: 355 KB

Attached Image (click to enlarge)
Click to Enlarge

Name: 2018-01-09_22-20-38.png
Size: 34 KB
Don't be a Lucky-trader! Just make cause-and-effect trades!
 
 
  • Post #44
  • Quote
  • Jan 9, 2018 11:43pm Jan 9, 2018 11:43pm
  •  t8936
  • | Commercial Member | Joined Dec 2017 | 87 Posts
Quoting VEEFX
Disliked
I would love to read your perspective on retail Spot FX market structure or the industry itself? Could a retail trader really trade fulltime and successfully earn income from trading in a deregulated decentralized environment?
Ignored
You should analyze Forex by LRA as forex is a mirror of futures.
Don't be a Lucky-trader! Just make cause-and-effect trades!
 
 
  • Post #45
  • Quote
  • Jan 10, 2018 4:51am Jan 10, 2018 4:51am
  •  pooh123
  • Joined Jul 2012 | Status: Member | 783 Posts | Online Now
A question, as the LRA reports have a 7-day lag, do they have any value for intraday trading ?
 
 
  • Post #46
  • Quote
  • Jan 10, 2018 6:35am Jan 10, 2018 6:35am
  •  t8936
  • | Commercial Member | Joined Dec 2017 | 87 Posts
Quoting pooh123
Disliked
A question, as the LRA reports have a 7-day lag, do they have any value for intraday trading ?
Ignored
LRA is a method of analysis and can't have lags

I think you mean "free LRA Reports which are 7 days delayed" by Tom Leksey (the creator of LRA), but it are just free real examples which should help you to fully undestand the method. If you need realtime Reports you need to have paid subscription or just do it by yourself
Don't be a Lucky-trader! Just make cause-and-effect trades!
 
 
  • Post #47
  • Quote
  • Jan 10, 2018 7:33am Jan 10, 2018 7:33am
  •  t8936
  • | Commercial Member | Joined Dec 2017 | 87 Posts
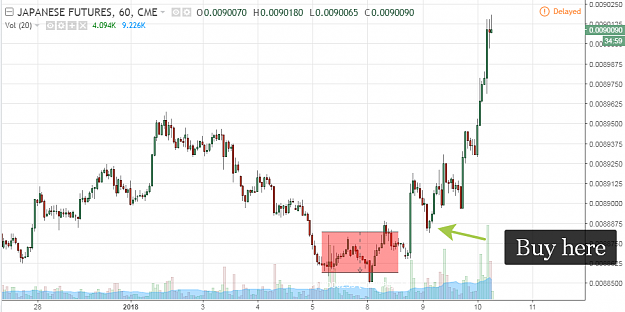
The continuation of yesterday's reply with JPY/USD analysis

Attached Image (click to enlarge)
Click to Enlarge

Name: 2018-01-10_16-25-28.png
Size: 33 KB
Don't be a Lucky-trader! Just make cause-and-effect trades!
 
 
  • Post #48
  • Quote
  • Jan 11, 2018 6:47am Jan 11, 2018 6:47am
  •  t8936
  • | Commercial Member | Joined Dec 2017 | 87 Posts
Why Do Instruments Correlate?

Market correlation is a statistical measure that determines how assets move in relation to each other (positive correlation – same direction; negative correlation – opposite direction).

Correlation is not permanent and is due to the fact that market participants make decisions on entering a separate trading instrument based on the value of others (they buy index futures forecasting the growth of other indices; they sell currency futures forecasting the strengthening of the dollar against other currencies), or open positions simultaneously on several instruments in the same direction.

Chart is the main market analysis tool for decision-making both on new and open positions, so the correlation in the trend period for different instruments shows the intervention of market sentiment, that is the prevailing open positions for each instrument, which show the opinion of market participants on how the instruments should correlate.
Don't be a Lucky-trader! Just make cause-and-effect trades!
 
 
  • Post #49
  • Quote
  • Edited 8:46am Jan 11, 2018 7:29am | Edited 8:46am
  •  pooh123
  • Joined Jul 2012 | Status: Member | 783 Posts | Online Now
Does Tom Leksey make the daily LRA report based on daily OI information from CME ? Is that OI information paid service at CME ?
 
 
  • Post #50
  • Quote
  • Jan 11, 2018 11:45am Jan 11, 2018 11:45am
  •  t8936
  • | Commercial Member | Joined Dec 2017 | 87 Posts
Quoting pooh123
Disliked
Does Tom Leksey make the daily LRA report based on daily OI information from CME ? Is that OI information paid service at CME ?
Ignored
Tom Leksey makes the daily LRA Reports based on LRA method which is described in his book "Locked-in Range Analysis: Why most traders must lose money in the futures market (Forex)".

Chart and the Volume are used to make Locked-in Range Analysis. No paid OI information is needed.

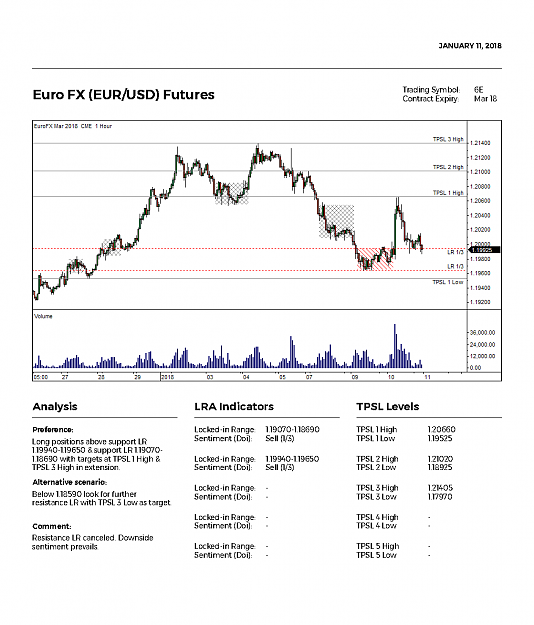
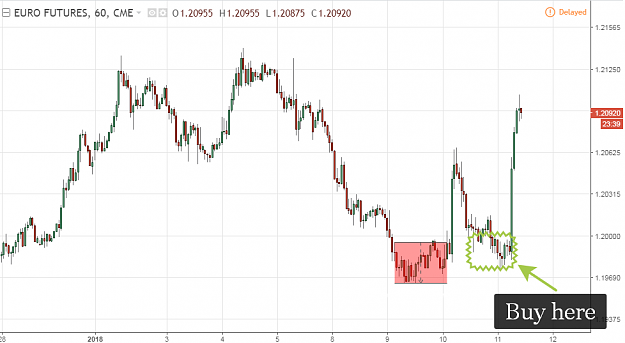
Look at the today's LRA and how it helps us to trade. Very simple!

EUR/USD
Attached Image (click to enlarge)
Click to Enlarge

Name: 6E.png
Size: 35 KB

Attached Image (click to enlarge)
Click to Enlarge

Name: 6E-2.png
Size: 28 KB


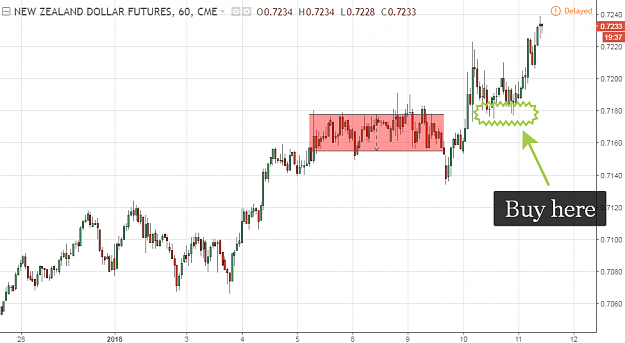
NZD/USD
Attached Image (click to enlarge)
Click to Enlarge

Name: 6N.png
Size: 34 KB

Attached Image (click to enlarge)
Click to Enlarge

Name: 6N-2.png
Size: 30 KB
Don't be a Lucky-trader! Just make cause-and-effect trades!
 
2
  • Post #51
  • Quote
  • Jan 11, 2018 12:22pm Jan 11, 2018 12:22pm
  •  Divergence
  • Joined Jul 2010 | Status: Member | 9,189 Posts
simple supply and demand I trade emini nasdaq better movement than all currency futures
 
 
  • Post #52
  • Quote
  • Edited 12:47pm Jan 11, 2018 12:33pm | Edited 12:47pm
  •  Trader-Waldo
  • | Membership Revoked | Joined Sep 2017 | 422 Posts
Quoting t8936
Disliked
{quote} Tom Leksey makes the daily LRA Reports based on LRA method which is described in his book "Locked-in Range Analysis: Why most traders must lose money in the futures market (Forex)". Chart and the Volume are used to make Locked-in Range Analysis. No paid OI information is needed. Look at the today's LRA and how it helps us to trade. Very simple! EUR/USD {image} {image} NZD/USD {image} {image}
Ignored
I looked your marked charts and could not understand logic or relate logic of LRA on those charts ("buy here"). Kindly describe the reasons of LRA when you post chart so I unfamiliar with LRA method can learn.
----


Where is Waldo here?
Attached Image
NO MATTER THE SITUATION,NEVER LET YOUR EMOTIONS OVERPOWER YOUR INTELLIGENCE
 
 
  • Post #53
  • Quote
  • Jan 11, 2018 1:40pm Jan 11, 2018 1:40pm
  •  VEEFX
  • Joined Jun 2006 | Status: Adios! | 3,377 Posts
Quoting t8936
Disliked
{quote} Tom Leksey makes the daily LRA Reports based on LRA method which is described in his book "Locked-in Range Analysis: Why most traders must lose money in the futures market (Forex)". Chart and the Volume are used to make Locked-in Range Analysis. No paid OI information is needed. Look at the today's LRA and how it helps us to trade. Very simple! EUR/USD {image} {image} NZD/USD {image} {image}
Ignored
No disrespect but all this is just fancy marketing material to trade simple Support and resistance levels via bounce or breakout or Supply Demand based trading. I don't care about chart setups in the history on H1 or D1... every trader can come up with 10 different price interpretation 'stories' on what price has done in the past and come up with 10 alternative theories on what price WILL do in the future to come up with directional bias and levels for SL and TP. All forums are littered by this nonsense.

I am ONLY interested in how Market Makers manage their ORDER BOOK... BOOK of open positions... their net risk exposure, how do they make money out of profiting from losing traders, stop hunts during range markets, signs of range breakouts via volume analysis etc

So when I asked earlier... do market makers make tradeable markets based on time series or based on number of acquired orders on their own book via timeframes? I am lost here (Like others) as to why this LRA stuff recommended to work only onD1 or H1 and not on M1 or Tick chart. Order flow and volumes cannot be timeframe dependent is the point I am trying to clarify. I am personally not interesting in what we see on charts (in relation to a centralized futures market.... if I move to Futures, I want a definitive edge that does not exist in Spot FX and that is volumes/centralized order flow. I will await to learn more on the market dynamics and micro structure elements of this book.

Respectfully,

Vee
Staying in my lane...
 
1
  • Post #54
  • Quote
  • Jan 12, 2018 3:02am Jan 12, 2018 3:02am
  •  t8936
  • | Commercial Member | Joined Dec 2017 | 87 Posts
Quoting VEEFX
Disliked
{quote} I don't care about chart setups in the history on H1 or D1...
Ignored
Sorry, but the examples above are not a history. That were realtime analysis and what happened next.

Earlier in this thread I showed you realtime analysis for CAD/USD and it also worked great.

But its not my goal to show you LRA examples (I was just asked to) I want to only discuss this method and find more variant for its use

Quoting VEEFX
Disliked
{quote}every trader can come up with 10 different price interpretation 'stories' on what price has done in the past
Ignored
You're wrong. LRA informs us what is happening now

Quoting VEEFX
Disliked
{quote}do market makers make tradeable markets based on time series or based on number of acquired orders on their own book via timeframes? I am lost here (Like others) as to why this LRA stuff recommended to work only onD1 or H1 and not on M1 or Tick chart.
Ignored
I answered you earlier for timeframe's question as I could. Unfortunately, I'm not an author and for more information please refer to the LRA book. Moreover, I just do not understand your question about marketmakers and time series
Don't be a Lucky-trader! Just make cause-and-effect trades!
 
 
  • Post #55
  • Quote
  • Jan 12, 2018 5:00am Jan 12, 2018 5:00am
  •  stoxos
  • Joined Feb 2016 | Status: Member | 259 Posts
Quote
Disliked
t8936
This method or the point of view on markets its logic and it works as it looks like. But i want to ask your opinion about the source of that information. What i mean is in the e-book Mr Leksey talks about market participants and the way they operate, i can validate that retails we work in that way, putting stoplosses and takeprofits on swing high low (i do that also, is common behavior).
What i can not validate is how he knows how the Market Makers operate, and i dont mean from google and other books or someone told him one time. I mean he was working in dealing desk, he was working on the exchange engine or something other technical and from that knows the structure of the market ? (Again your opinion only not asking the proofs from you i will probably contact him)

P.S. if someone is patient and do some Money Management LRA will be probably profitable long term for him.

Thank you.
 
 
  • Post #56
  • Quote
  • Jan 12, 2018 5:56am Jan 12, 2018 5:56am
  •  pooh123
  • Joined Jul 2012 | Status: Member | 783 Posts | Online Now
Quoting VEEFX
Disliked
{quote} No disrespect but all this is just fancy marketing material to trade simple Support and resistance levels via bounce or breakout or Supply Demand based trading.
Ignored
I kind of echo VEEFX's comment. Also, I found that, the views of Tom Leksey's book is fundamentally flawed. I checked out CME's website and found that, they only use Market Makers for some instruments, and currency futures and ES are not among those instruments handled by Market Makers. CME maintain there a detailed list of all Market Makers they use and relevant scope of instruments. As far as currency is concerned, they only use MM for FX futures block, not regular currency futures. So the very foundation of that LRA book is wrong, as far as currency futures and some other futures are concerned.
 
1
  • Post #57
  • Quote
  • Jan 12, 2018 5:44pm Jan 12, 2018 5:44pm
  •  VEEFX
  • Joined Jun 2006 | Status: Adios! | 3,377 Posts
Quoting t8936
Disliked
{quote} Sorry, but the examples above are not a history. That were realtime analysis and what happened next. Earlier in this thread I showed you realtime analysis for CAD/USD and it also worked great. But its not my goal to show you LRA examples (I was just asked to) I want to only discuss this method and find more variant for its use {quote} You're wrong. LRA informs us what is happening now {quote} I answered you earlier for timeframe's question as I could. Unfortunately, I'm not an author and for more information please refer to the LRA book....
Ignored
perhaps I am not following you then.

https://www.forexfactory.com/attachm...3&d=1515689030

In this chart, it appears you are drawing rectangle in the history to see where the support area exists and then waiting for a bounce off the support.

I had to remove image editing software from my trading computer to avoid speculation on charts so cant point arrows but tell us WHY you did not go short on the breakout of the range? Tell us why the price spiked moved down and quickly moved up on that candle (and not interpreting AFTER the fact... I can only tell why after the fact). I want to understand the NOW aspect of this strategy which I (and most others) are still struggling to understand. Outside of charts, what else are you seeing/analyzing that we fail to understand. There is meat in this story so I am just trying to get to the bottom of it as quickly as possible. Understanding logic of price behavior from the eyes of market maker and not as a trader from charts is what I am particularly interested in.

Please know that I am not questioning the validity of this strategy or the author. I am only here to understand market making business and the strategies they incorporate to manage their overall exposure without going bankrupt. Many multi-position traders don't realize this important aspect of portfolio management. How do market makers MANAGE their own drawdowns in a second by second every changing market of orders coming in and orders going out. They MAKE the market... there is no one else to pass the order to. And no one has unlimited funds except the large banks and CBs... hence my curiosity.
Staying in my lane...
 
 
  • Post #58
  • Quote
  • Jan 12, 2018 6:33pm Jan 12, 2018 6:33pm
  •  stoxos
  • Joined Feb 2016 | Status: Member | 259 Posts
Quoting VEEFX
Disliked
{quote} perhaps I am not following you then. https://www.forexfactory.com/attachm...3&d=1515689030 In this chart, it appears you are drawing rectangle in the history to see where the support area exists and then waiting for a bounce off the support. I had to remove image editing software from my trading computer to avoid speculation on charts so cant point arrows but tell us WHY you did not go short on the breakout of the range? Tell us why the price spiked moved down and quickly moved up on that candle (and not...
Ignored
First of all its not a strategy is an ANALYSIS, a way to read the market and the activity of their participants in order to find good opportunities. In the book says that you use the analysis on par with your own Technic.
Second the book is not that helpful and the examples also, so i understand your confusion.
Forth the author of the LRA shows examples, but not his positions or how he trades and manages everything.
Fifth if you read again the book and you pay attention to some small details you will understand even the author which he states has study for a lot of years futures markets doesnt have any answer about what is happened inside the range, it is something after effect its like trading the reaction not the cause.
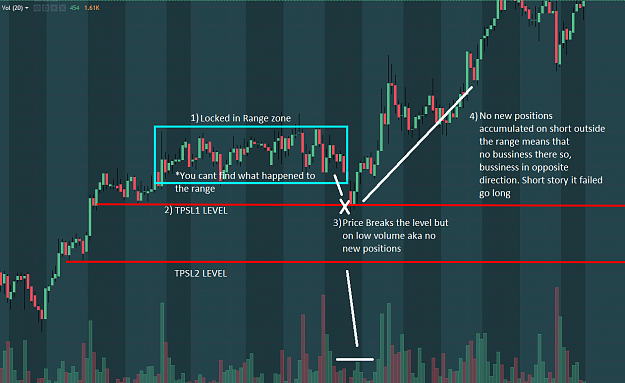
End of story here is the example of what you asked to be answered.

Logic:
1) Find a range on H1 TF no less no more
2) Find TP SL levels, those are on high low of swings
3) When price breaks or reach those levels watch volume (REAL ONLY volume from Futures you can you tradingview its free)
4) If volume on the first level was high then you follow that direction, when a pullback happen you enter
5) Else If volume was low then open a trade for the opposite side

The New Zealand example


P.S. Hope i helped and make it clear
Attached Image (click to enlarge)
Click to Enlarge

Name: LRAEX.png
Size: 88 KB
1
 
  • Post #59
  • Quote
  • Jan 12, 2018 11:23pm Jan 12, 2018 11:23pm
  •  VEEFX
  • Joined Jun 2006 | Status: Adios! | 3,377 Posts
Quoting stoxos
Disliked
{quote} First of all its not a strategy is an ANALYSIS, a way to read the market and the activity of their participants in order to find good opportunities. In the book says that you use the analysis on par with your own Technic. Second the book is not that helpful and the examples also, so i understand your confusion. Forth the author of the LRA shows examples, but not his positions or how he trades and manages everything. Fifth if you read again the book and you pay attention to some small details you will understand even the author which he states...
Ignored
Thanks for your time. If LRA is focussed on the NOW, how would you know "where" to precisely trigger your entry. This is really no different than trading a naked chart and punting here and there with some hits and some misses and pray to get to breakeven+ by the end of your accounting period. Directional bias - after the fact
Razor sharp entries - hard because of h1
SL placement -Hard as you will become the feeder to the big boys.

I wiill say this one more time. There is no long term edge to be found in charts without external influence or analysis (fundamentals, order flow, MTF, momentum/money flow etc)

Such charts are only good to generate page hits and attract followers and turning noobs to into dreamers. Charts are the number one reason by 90% of strategies fail...Just my 2 cents.
Staying in my lane...
 
 
  • Post #60
  • Quote
  • Jan 13, 2018 12:14am Jan 13, 2018 12:14am
  •  pooh123
  • Joined Jul 2012 | Status: Member | 783 Posts | Online Now
Quoting VEEFX
Disliked
{quote} Such charts are only good to generate page hits and attract followers and turning noobs to into dreamers. Charts are the number one reason by 90% of strategies fail...Just my 2 cents.
Ignored
I don't mean to be disrespectful to the OP. In fact I appreciate any effort to share an idea, to which I agree or not.
Above all, as I said earlier, there are no Market Makers for currency futures, as I found at CME website. And, supply demand traders can easily identify the Locked in Range as support/resistance zones. The Locked in Ranges are not holy grail. Sometimes they hold, some other times they don't. The Locked in Range is just a new name for support/resistance zone. When people give new name to old things that usually means one thing- they will sell some thing. In this case Tom Lecksey does sell something- subscription to his daily LRA report.
 
 
  • Commercial Content
  • /
  • Locked-in Range Analysis (LRA)
  • Reply to Thread
    • 1 2Page 3456 8
    • 1 2Page 34 8
0 traders viewing now
  • More
Top of Page
  • Facebook
  • Twitter
About FF
  • Mission
  • Products
  • User Guide
  • Media Kit
  • Blog
  • Contact
FF Products
  • Forums
  • Trades
  • Calendar
  • News
  • Market
  • Brokers
  • Trade Explorer
FF Website
  • Homepage
  • Search
  • Members
  • Report a Bug
Follow FF
  • Facebook
  • Twitter

FF Sister Sites:

  • Metals Mine
  • Energy EXCH
  • Crypto Craft

Forex Factory® is a brand of Fair Economy, Inc.

Terms of Service / ©2023