Locked-in Range Analysis (abbr. LRA) is the futures market analysis method, described in the ebook "Locked-in Range Analysis: Why most traders must lose money in the futures market (Forex)" by Tom Leksey, which minimizes an uncertainty in the futures market.
LRA is the method of interpreting the price and volume chart to determine the direction of the prevailing volume of open positions, the imbalance of which will enlighten you to future market behavior.
LRA is a cause-and-effect analysis method arising from the basis of the market, therefore, by applying LRA, you will either become one of the professional market participants getting a non-random and repeatable result or you will consciously leave trading for good.
LRA ebook may be published, reproduced or distributed for Free - Download PDF (0.7 MB)
LRA gives you answers for questions: 
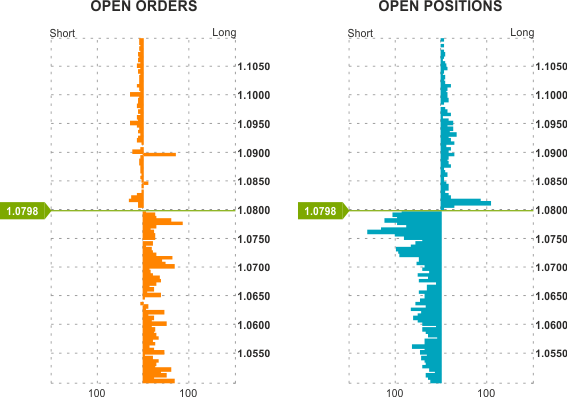
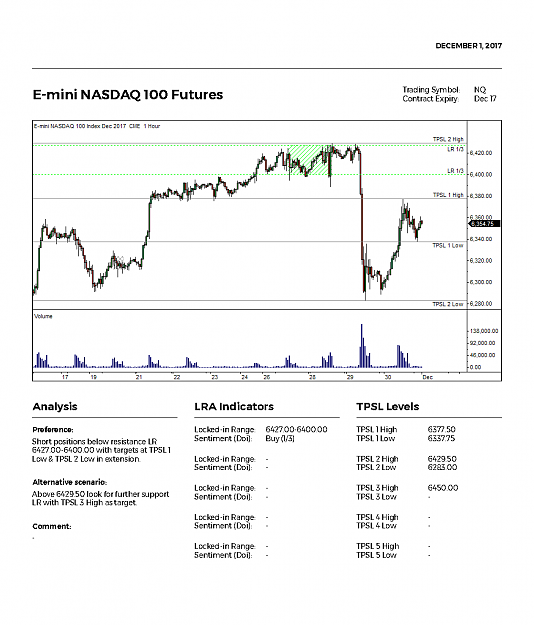
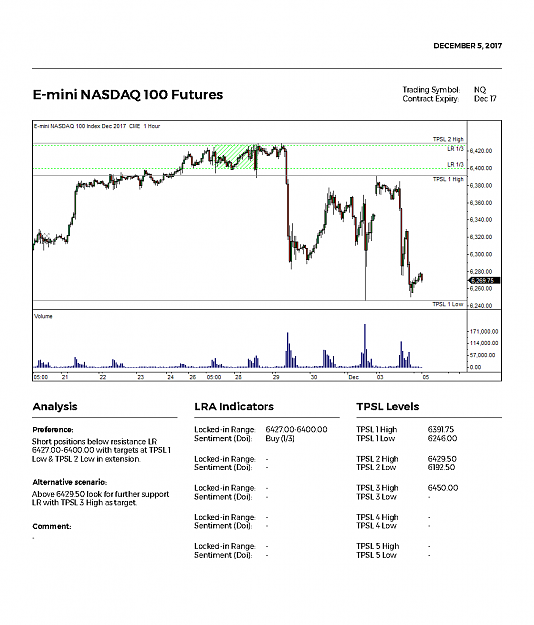
Resistance LR is the locked-in range in which the volume of open buy positions prevails, and it is profitable for the market maker to quote prices below the range.

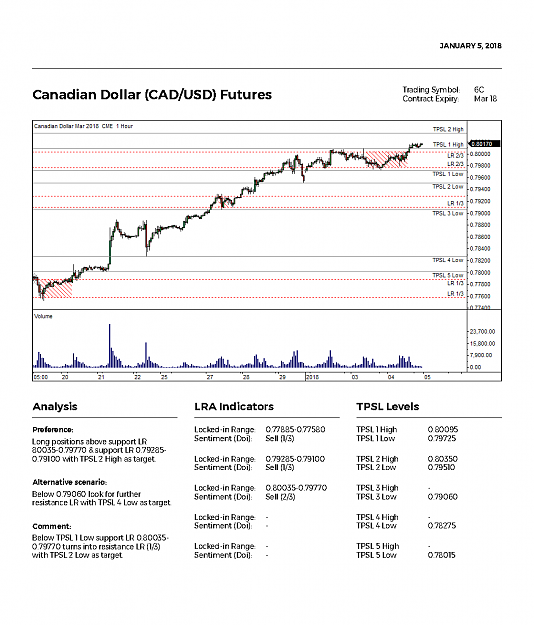
Support LR is the locked-in range in which the volume of open sell positions prevails, and it is profitable for the market maker to quote prices above the range.

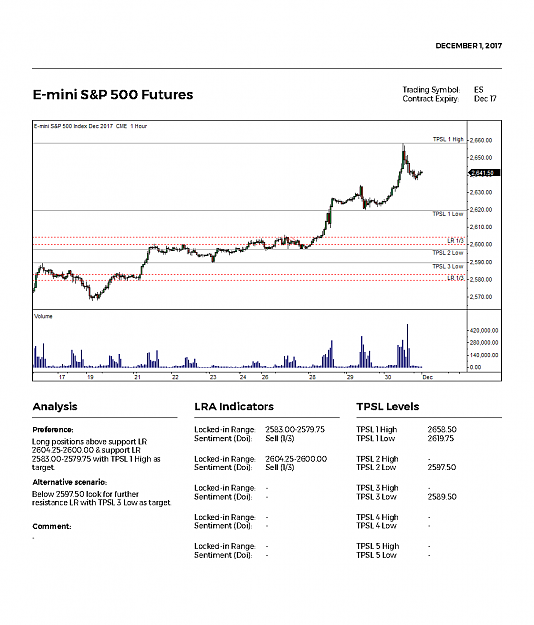
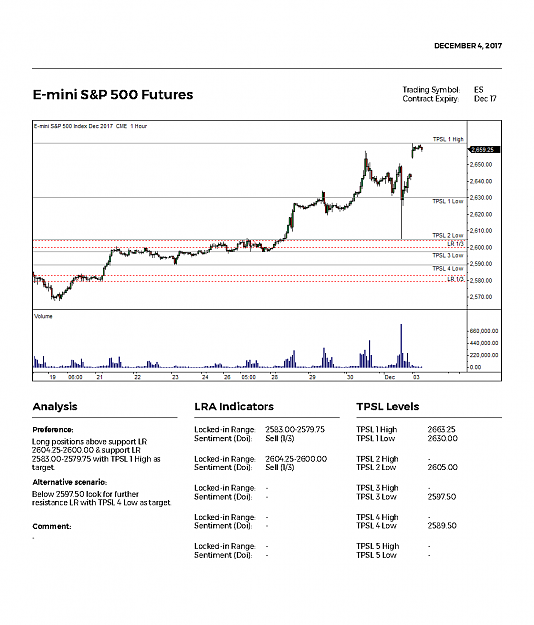
The logic of price changes in the futures markets, where liquidity is provided by market makers
Open positions, their take-profits and stop-losses are the only true source of information for making decisions on speculative entry into the futures market with the market maker, therefore, those who do not base their trading decisions on it are Lucky-traders.
LRA is the method of interpreting the price and volume chart to determine the direction of the prevailing volume of open positions, the imbalance of which will enlighten you to future market behavior.
LRA is a cause-and-effect analysis method arising from the basis of the market, therefore, by applying LRA, you will either become one of the professional market participants getting a non-random and repeatable result or you will consciously leave trading for good.
LRA ebook may be published, reproduced or distributed for Free - Download PDF (0.7 MB)
LRA gives you answers for questions:
- Why Does Price Change Occur?
- Why Do Instruments Correlate?
- Value of Trading Session and Time-Frame
- Impact of Fundamental Factors on Price
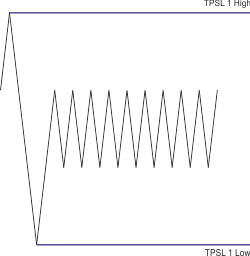
What is Locked-in Range?
Locked-in Range (abbr. LR) is the trading range in which the volume of open positions accumulates, making the price change to the side where the prevailing volume of open positions will be locked at a loss, because the price will no longer allow to close in profits or break-even.
Attached Image
Resistance LR is the locked-in range in which the volume of open buy positions prevails, and it is profitable for the market maker to quote prices below the range.
Attached Image
Support LR is the locked-in range in which the volume of open sell positions prevails, and it is profitable for the market maker to quote prices above the range.
Attached Image
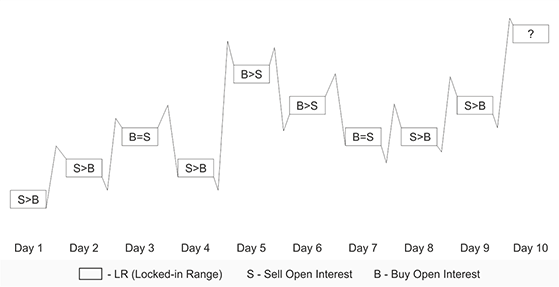
The logic of price changes in the futures markets, where liquidity is provided by market makers
Attached Image
Open positions, their take-profits and stop-losses are the only true source of information for making decisions on speculative entry into the futures market with the market maker, therefore, those who do not base their trading decisions on it are Lucky-traders.
Don't be a Lucky-trader! Just make cause-and-effect trades!