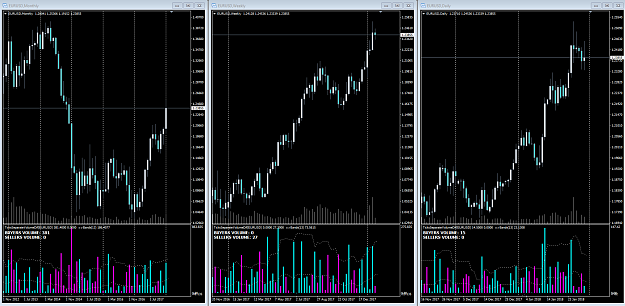
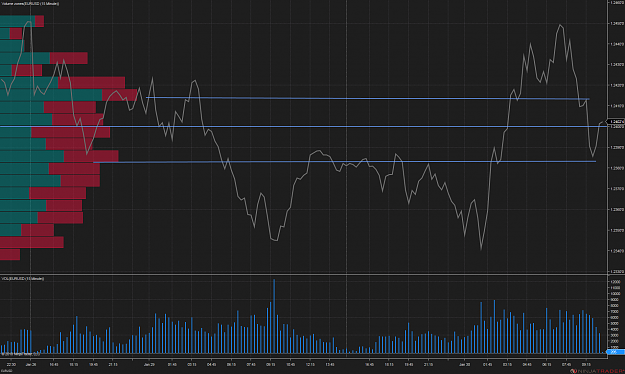
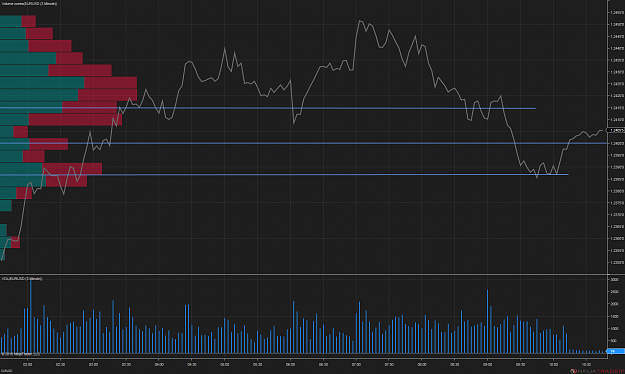
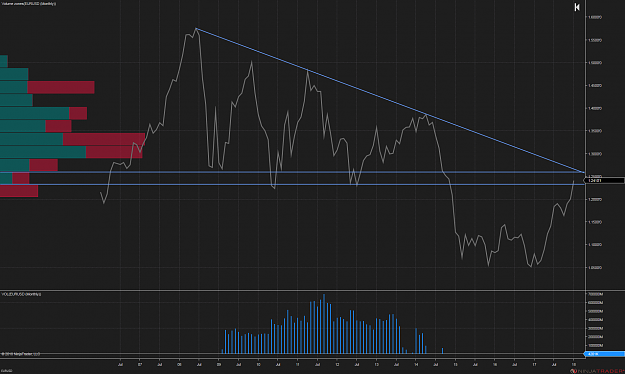
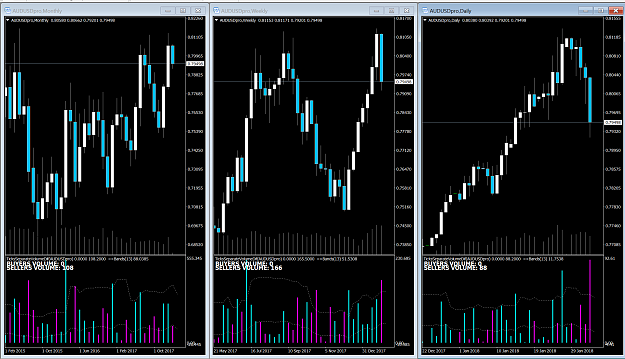
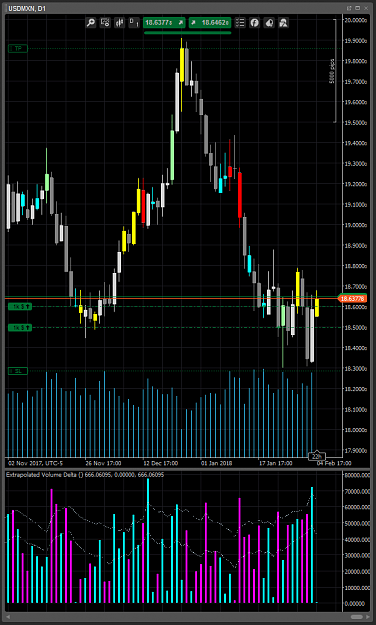
• Home
  • Forums
  • Trades
  • News
  • Calendar
  • Market
  • Brokers
  • Login
  • Join
  • User/Email: Password:
  • 7:45pm
Menu
  • Forums
  • Trades
  • News
  • Calendar
  • Market
  • Brokers
  • Login
  • Join
  • 7:45pm
Sister Sites
  • Metals Mine
  • Energy EXCH
  • Crypto Craft

Options

Bookmark Thread

First Page First Unread Last Page Last Post

Print Thread

Similar Threads

Hey, Newbie got some questions 12 replies

Hey all 1 reply

Hey! yellow news...??? 3 replies

hey all 11 replies

  • Trading Discussion
  • /
  • Reply to Thread
  • Subscribe
  • 295
Attachments: Hey...what about Volume?
Exit Attachments
Tags: Hey...what about Volume?
Cancel

Hey...what about Volume?

  • Last Post
  •  
  • 1 910Page 111213 39
  • 1 10Page 1112 39
  •  
  • Post #201
  • Quote
  • Jan 29, 2018 6:37pm Jan 29, 2018 6:37pm
  •  LookinGood
  • | Joined Jan 2017 | Status: Member | 238 Posts
Quoting DonPato
Disliked
{image} This is what I am working on. I have done the calculations with Excel and can graph them but putting them together with price action is a royal pain and I am unable to get this to line up perfectly...however... Look at how the delta volume differs entirely from just tick volume. Again this is extrapolated, and I need to study it more and would really need a programmer to help out...I'm sure for a coder, it could be done in a few hours. I am doing it by hand on just EUR/USD
Ignored
Hey Don,

Long time.

Question:
This Volume Delta indicator you want programmed, is this an attempt to see when larger orders (ie. 5 100 lots -> larger orders vs 100 5 lots -> small orders) are coming through?

Also where are you getting your real volume numbers from, CME? Why not just compare CME Vol to CME tick?

Looks like you're headed in the right direction but you might be going off track with this volume thing.
 
1
  • Post #202
  • Quote
  • Jan 29, 2018 9:04pm Jan 29, 2018 9:04pm
  •  DonPato
  • Joined Dec 2015 | Status: Member | 1,509 Posts
Quoting LookinGood
Disliked
{quote} Hey Don, Long time. Question: This Volume Delta indicator you want programmed, is this an attempt to see when larger orders (ie. 5 100 lots -> larger orders vs 100 5 lots -> small orders) are coming through? Also where are you getting your real volume numbers from, CME? Why not just compare CME Vol to CME tick? Looks like you're headed in the right direction but you might be going off track with this volume thing.
Ignored
I might be, but I have to chase this rabbit down the hole until I come to the dead end...perhaps this is why it take me so long to learn something new!!

I am seeing a pattern in the spot prices that directly parallels my future trading and I believe I can use that to my advantage. Using futures volumes works OK, but I find it difficult to be going back and forth between platforms trying to correlate movements that often don't look the same in futures as they do in spot. I think the use of this simple indicator (as I tried to show above) will work wonders and allow me to identify inflection and swing points as they are occurring.

This information is valuable to me as it lets me know the big question...WHEN. Order size data (at least on my platform) is unavailable to me but using Volume delta (even if its tick volume) allows me to visualize this pattern more clearly, and keeps me on the right side of the market more often.

Hope you and yours are well and your trading is doing well.
Do more of that which succeeds and less of that which does not - Dennis Gar
 
 
  • Post #203
  • Quote
  • Jan 29, 2018 11:59pm Jan 29, 2018 11:59pm
  •  Trader-Waldo
  • | Membership Revoked | Joined Sep 2017 | 422 Posts
Quoting DonPato
Disliked
{quote} I might be, ....I think the use of this simple indicator (as I tried to show above) will work wonders and allow me to identify inflection and swing points as they are occurring. This information is valuable to me as it lets me know the big question...WHEN. ...allows me to visualize this pattern more clearly, and keeps me on the right side of the market more often. ....
Ignored
Hi Don,
Did you try "Market facilitation Index"/Bill Williams indicator built in MT4/5? 2 signals over there is telling you for "swing" and "when". you can google for more information /description of signals. ..what pattern are you talking about? do you want to show it on chart?
NO MATTER THE SITUATION,NEVER LET YOUR EMOTIONS OVERPOWER YOUR INTELLIGENCE
1
 
  • Post #204
  • Quote
  • Jan 30, 2018 12:44am Jan 30, 2018 12:44am
  •  DonPato
  • Joined Dec 2015 | Status: Member | 1,509 Posts
Quoting Trader-Waldo
Disliked
{quote} Hi Don, Did you try "Market facilitation Index"/Bill Williams indicator built in MT4/5? 2 signals over there is telling you for "swing" and "when". you can google for more information /description of signals. ..what pattern are you talking about? do you want to show it on chart?
Ignored
I've been showing them over and over again... climax, exhaustion, absorption...look at my last chart. As I mentioned in the beginning I knew this would be a challenge using tick volume but it's worth it if I can figure it out.

Bill Williams' indicators like all the other stuff out there is lagging...as it only could. You don't really think they'd put something profitable on a free software platform do you?

Volume order flow and price are the only "real time" data components that work. I am only trying to fill a gaping hole in spot data that doesn't provide actual volume. I have to extrapolate it by using tick volume...but I think it can be done with relative accuracy on large charts like daily, weekly charts... anything smaller and you need real data to use.
Do more of that which succeeds and less of that which does not - Dennis Gar
 
2
  • Post #205
  • Quote
  • Jan 30, 2018 3:38am Jan 30, 2018 3:38am
  •  rosalieone
  • Joined Sep 2009 | Status: Member | 516 Posts | Online Now
I found something in the commercial area
Is it what your looking for ?: https://www.mql5.com/en/market/product/12053#
 
 
  • Post #206
  • Quote
  • Jan 30, 2018 8:39am Jan 30, 2018 8:39am
  •  DonPato
  • Joined Dec 2015 | Status: Member | 1,509 Posts
Quoting rosalieone
Disliked
I found something in the commercial area Is it what your looking for ?: https://www.mql5.com/en/market/product/12053#
Ignored
Something more like this...https://www.mql5.com/en/market/product/11658

I tried to download this and it didn't work.
Do more of that which succeeds and less of that which does not - Dennis Gar
 
 
  • Post #207
  • Quote
  • Jan 30, 2018 9:04am Jan 30, 2018 9:04am
  •  AlexMill
  • | Joined Jan 2018 | Status: Member | 9 Posts
Thank you for this usefull thread
 
 
  • Post #208
  • Quote
  • Jan 30, 2018 10:46am Jan 30, 2018 10:46am
  •  DonPato
  • Joined Dec 2015 | Status: Member | 1,509 Posts
Quoting AlexMill
Disliked
Thank you for this usefull thread
Ignored
I hope you will find value here.
Do more of that which succeeds and less of that which does not - Dennis Gar
 
 
  • Post #209
  • Quote
  • Jan 30, 2018 11:56am Jan 30, 2018 11:56am
  •  DonPato
  • Joined Dec 2015 | Status: Member | 1,509 Posts
Hello All...lack of conversation on the thread, so I thought I would show you these futures trades from the last few days. I think these may also help illustrate what it is I'm trying to accomplish here on the spot fx side.

You will see notes that I made to myself at the end of each day's trading to help me keep track of my execution. The indicator at the bottom of these charts is what I am trying to reproduce here on spot fx
Attached Image(s) (click to enlarge)
Click to Enlarge

Name: 01-22-18.PNG
Size: 138 KB
Click to Enlarge

Name: 01-24-18.PNG
Size: 134 KB
Click to Enlarge

Name: 01-26-18.png
Size: 117 KB
Click to Enlarge

Name: 01-30-18.PNG
Size: 103 KB
Do more of that which succeeds and less of that which does not - Dennis Gar
 
3
  • Post #210
  • Quote
  • Jan 30, 2018 12:08pm Jan 30, 2018 12:08pm
  •  Darryl
  • Joined May 2011 | Status: Member | 140 Posts
Greetings Don, I've been keeping up with your thread every day.
Have you checked out this volume indicator? Looks interesting.
It seems to coincide with Climax Absorption and Exhaustion.
Attached File(s)
File Type: ex4 TicksSeparateVolume.ex4   14 KB | 715 downloads
File Type: mq4 TicksSeparateVolume.mq4   5 KB | 798 downloads
 
2
  • Post #211
  • Quote
  • Jan 30, 2018 12:24pm Jan 30, 2018 12:24pm
  •  DonPato
  • Joined Dec 2015 | Status: Member | 1,509 Posts
Quoting Darryl
Disliked
Greetings Don, I've been keeping up with your thread every day. Have you checked out this volume indicator? Looks interesting. It seems to coincide with Climax Absorption and Exhaustion. {file} {file}
Ignored
I am away from the computer but will try it this evening... thanks
Do more of that which succeeds and less of that which does not - Dennis Gar
 
 
  • Post #212
  • Quote
  • Jan 30, 2018 1:53pm Jan 30, 2018 1:53pm
  •  DonPato
  • Joined Dec 2015 | Status: Member | 1,509 Posts
Quoting DonPato
Disliked
{quote} I am away from the computer but will try it this evening... thanks
Ignored
We have a winner!!
Attached Image (click to enlarge)
Click to Enlarge

Name: Screenshot1.png
Size: 104 KB

This appears to be plotting the volume delta in the same way I was calculating it on my spreadsheet. I have added a bollinger band on top to help identify relative climax from exhaustion, although it should be fairly obvious. I'm not really a fan of MT4 and I know its being phased out, but I think with this I can continue my observations and keep moving forward.

Thank you Darryl very kindly for bringing this to my attention
Do more of that which succeeds and less of that which does not - Dennis Gar
 
 
  • Post #213
  • Quote
  • Jan 30, 2018 2:28pm Jan 30, 2018 2:28pm
  •  goma
  • | Joined May 2015 | Status: Member | 599 Posts
Hi Don, the chart above I see is similar to a broker I used to be able to trade with here in the US (fxcm). I can still use their graphs but no trades since early last year.
That's a topic for another thread. However, their charts (not M4) showed the option of tic vol at the bottom, plus a buy vol vs sell vol if you wanted. Again, it was
that particular broker's vol on the retail level, so only a tiny portion of the forex mkt. I found on the higher time frames it more closely coincided with actual price,
but for swing trades and scalps esp., you are more at the mercy of news and your market maker.
Not trying to dissuade you from the volume search/discussion, I do believe you can use it as an edge, but as an exercise, try the following, post your graphs, monthly on down, with no indicators and make them line (end of timeframe price) graphs. Below are eurusd I've been following/trading. The horizontal blue lines I drew in
as my view on where most of the trading occurs, the 1.240 level being roughly the main attraction. On down it looks to me that the 1.2415 high and 1.2385 low are the
short term ranges.
Nest post has the same graphs with tic vol below and vol at price to the left.
regards
goma
Attached Image(s) (click to enlarge)
Click to Enlarge

Name: EURUSD (1 Month) 2018_01-1.png
Size: 95 KB
Click to Enlarge

Name: EURUSD (15 Minute) 2018_01_30.png
Size: 119 KB
Click to Enlarge

Name: EURUSD (3 Minute) 2018_01_30-1.png
Size: 103 KB
 
 
  • Post #214
  • Quote
  • Jan 30, 2018 2:35pm Jan 30, 2018 2:35pm
  •  goma
  • | Joined May 2015 | Status: Member | 599 Posts
Here are the same ones with vol at price and tic vol....
They are not too far off, I could be wrong about where I put the blue lines, but as a general rule starting with the higher time frames seems to
help narrow it down to zones to trade or avoid. I have been using the vol indicators as more of a confirmation rather than a trade indicator. I have seen
some of the other threads (PVSRA in particular) often seem to use tic vol spikes as a notice to quickly jump in or at least be ready to make a move.
Anyways, food for thought. Keep up the good work,
regards,
goma
Attached Image(s) (click to enlarge)
Click to Enlarge

Name: EURUSD (1 Month) 2018_01-1.png
Size: 95 KB
Click to Enlarge

Name: EURUSD (15 Minute) 2018_01_30-1.png
Size: 126 KB
Click to Enlarge

Name: EURUSD (3 Minute) 2018_01_30.png
Size: 107 KB
 
 
  • Post #215
  • Quote
  • Jan 30, 2018 2:36pm Jan 30, 2018 2:36pm
  •  goma
  • | Joined May 2015 | Status: Member | 599 Posts
posted the same monthly twice
Attached Image (click to enlarge)
Click to Enlarge

Name: EURUSD (1 Month) 2018_01-1.png
Size: 95 KB
 
 
  • Post #216
  • Quote
  • Jan 30, 2018 2:38pm Jan 30, 2018 2:38pm
  •  goma
  • | Joined May 2015 | Status: Member | 599 Posts
one more time
Attached Image (click to enlarge)
Click to Enlarge

Name: EURUSD (1 Month) 2018_01.png
Size: 120 KB
 
 
  • Post #217
  • Quote
  • Jan 30, 2018 3:09pm Jan 30, 2018 3:09pm
  •  DonPato
  • Joined Dec 2015 | Status: Member | 1,509 Posts
I see what you are getting at, and the volume levels are extremely helpful. I used to be with FXCM but got burned and have not returned. Again, what I am trying to accomplish here...and I feel I am very close. Is to duplicate (as close as possible) to the futures trades I showed you. In that indicator you see the delta volume of (actual) buyers and sellers activity live as it comes across the market. When one side or the other becomes dominant it is quite clear in both price activity and volume.

In addition, when the two sides are balanced, you see the very small bars (on the indicator) telling you that the buying and selling are nearly balance but that one side or the other has a slight dominance, but one that could be easily overcome with large opposing volume. Finally, you can see the "anomalous" volumes...those volumes where even though buying was the dominating volume, the candle finished bearish (and vise versa). These are absorption areas that often indicate tops, bottoms, or at least a heads up on the next level of resistance/support.

I realize that without "true" volume those anomalous candles will never appear in the spot forex, however that doesn't mean this same phenomenon isn't occurring...we just can't spot it. However, we can see how price reacts and extrapolate. Again, DELTA is what is left over after everything cancels out...

As an example, if there are 300 lots of buying, and 400 lots of selling, the delta is 100 lots selling. (400-300 = 100). This assumes a 1:1 ratio of buying and selling, which isn't always the case but it is the structure of the market. If one order is larger than another, the market fills what it can and the residual is left unfilled, and the market ticks up (or down) in an attempt to fill the rest. Thus if all the buyers cancel out all the sellers, there would be a delta of ZERO...this almost never happens. The left over, unfilled orders in the market, will always cause the market to tick up (or down). Thus by watching this flow (literally the order flow), we can determine which side is exhausting and ready to stop...this usually leads to a change in the order flow from dominance to balance at least for a while. Then the balance will turn to dominance again, depending on which side dominates the flow. We can get an early heads up on that when we observe where once side exhausts and is then absorbed (causing price action to stop)...this happens BEFORE the other side dominates the order flow...in other words...a swing point is formed and you have automatic confirmation of that swing point, by the order flow.

No more waiting to "confirm" with price action and have a stop that's 300 pips away...I trade the daily chart with 25-75 pips stops and am looking for anywhere from 300-600 pips...the same as I do with futures. Well...the futures stops are a LITTLE tighter...11 ticks looking for 31 ticks profit, but you get the picture...I hope.
Do more of that which succeeds and less of that which does not - Dennis Gar
 
 
  • Post #218
  • Quote
  • Jan 31, 2018 12:44pm Jan 31, 2018 12:44pm
  •  DonPato
  • Joined Dec 2015 | Status: Member | 1,509 Posts
Hello again friends...I was just talking to a friend and we were comparing platforms as I was telling him about using the indicator Darryl sent us. Yesterday I was excited about it, today I'm not so sure. While the indicator does work as designed, I am concerned about the data it is using...

This has always been a concern in the spot forex market but is even more complicated using MT4 and different brokers. The data is simply not the same from one place to the next. It will therefore give conflicting or even erroneous signals. Yet another reason why I don't like MT4. I have not yet made this comparison between cTrader brokers, as I have only used one so far. However I do plan on doing this soon...(project #1,257)

In short, it is incumbent upon all of us to check out our particular broker, and ask WHERE they get their data. Their answer should be something straight forward and easy to understand...like, "we get our data information from the exchange on our liquidity provider, Dukoscopy." If you get a long drawn out explanation involving intermediaries and, "it depends because we use different liquidity providers to give you the best price...blah, blah, blah..." It might be best to find a broker with more trustworthy data.

I am still working on my project for coding cAlgo but now have a healthy distrust of the mt4 platform and think you should too, especially if you are using it to trade. I am still investigating, but I do not think mt5 will be much better as it is still using the same (cheating) infrastructure.

I might just keep my spreadsheet going and do it the hard way.
Do more of that which succeeds and less of that which does not - Dennis Gar
 
 
  • Post #219
  • Quote
  • Feb 2, 2018 12:36pm Feb 2, 2018 12:36pm
  •  DonPato
  • Joined Dec 2015 | Status: Member | 1,509 Posts

Hello again all,


I am trying out my own coding on cAlgo. Yes I found someone to do the coding for me, but I designed the indicator which I call "Extrapolated Volume Delta". Have a look. Today's trading on AUD/USD was extremely telling but also over the past few days you can clearly see the signals...Climax, Exhaustion, Absorption...which also coincided almost exactly with the top of a range seen best on the monthly chart (on the left). I have been using this broker for quite some time now and find the data is satisfactory to make conclusions about the accuracy of this code. So I will keep you updated.

Attached Image (click to enlarge)
Click to Enlarge

Name: Screenshot1.png
Size: 272 KB


Now lets compare this with the MT4 Platform.


Attached Image (click to enlarge)
Click to Enlarge

Name: Screenshot3.png
Size: 78 KB

The differences are subtle but significant...can you spot them?
Do more of that which succeeds and less of that which does not - Dennis Gar
 
1
  • Post #220
  • Quote
  • Feb 4, 2018 6:27pm Feb 4, 2018 6:27pm
  •  DonPato
  • Joined Dec 2015 | Status: Member | 1,509 Posts
Hello All,

Market just opened here and I am putting some finishing touches on the new indi to assist me in making trading decisions. I caught this on the USD/MXN that I thought we might all watch together.
Attached Image (click to enlarge)
Click to Enlarge

Name: Screenshot1.png
Size: 53 KB

You can see here that the selling side as pretty much exhausted itself and even though the last several days of selling were "strong" volume delta, sellers could not post a new low. As well, last friday, buyers came in with climax volume and pushed price out of "the hole" again. I had entered two positions last week on the climax candle (indicated in green) using VSA analysis, and I had to live with the retest on Thursday and Friday.

On a note of interest as well, the difference in Delta Volume (as opposed to VSA) you can see that even though the candle posted as a climax volume with a wide range (as per the VSA rules), the buying volume inside the candle was not as strong. It did however show a very important thing...absorption. To me this absorption means the buyers are absorbing even strong selling volume. This is usually an indication the larger traders are either taking profits or buying the market in larger quantities to absorb all that selling. As soon as the late sellers give up (ie stop out), there may possibly be a "whoosh" higher to retest the last high.
Do more of that which succeeds and less of that which does not - Dennis Gar
 
3
  • Trading Discussion
  • /
  • Hey...what about Volume?
  • Reply to Thread
    • 1 910Page 111213 39
    • 1 10Page 1112 39
0 traders viewing now
  • More
Top of Page
  • Facebook
  • Twitter
About FF
  • Mission
  • Products
  • User Guide
  • Media Kit
  • Blog
  • Contact
FF Products
  • Forums
  • Trades
  • Calendar
  • News
  • Market
  • Brokers
  • Trade Explorer
FF Website
  • Homepage
  • Search
  • Members
  • Report a Bug
Follow FF
  • Facebook
  • Twitter

FF Sister Sites:

  • Metals Mine
  • Energy EXCH
  • Crypto Craft

Forex Factory® is a brand of Fair Economy, Inc.

Terms of Service / ©2023