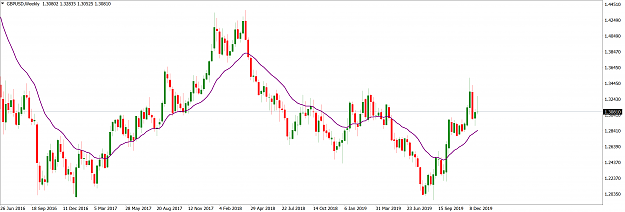
GBPAUD Weekly Technical Outlook
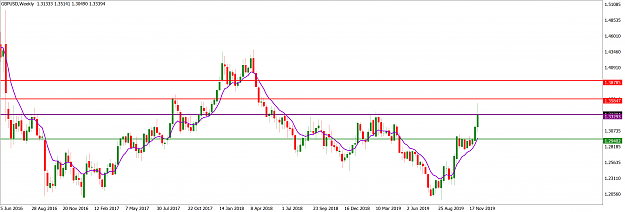
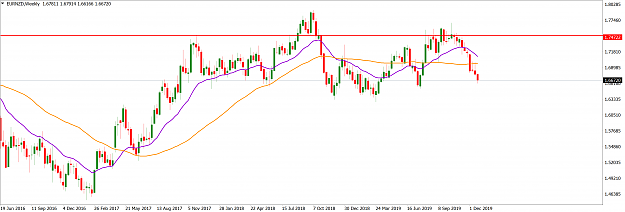
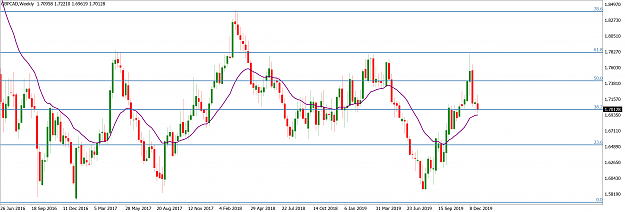
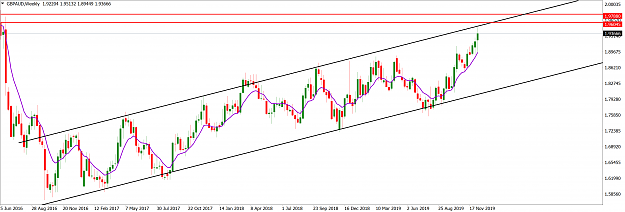
The GBPAUD market is disposed northwards. On the weekly time frame, market operation is within a rising channel (black) and bulls are heading towards the channel resistance trendline. The bullish candlestick printed last week nestled at the channel resistance trendline but ended up with shadows at both ends. Should bulls breach the channel resistance trendline northwards, they will have to contend with the 1.96050 horizontal resistance area.
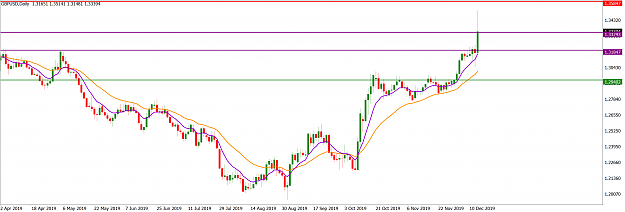
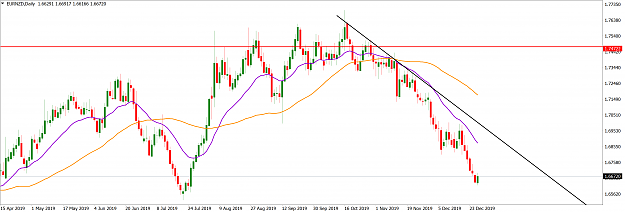
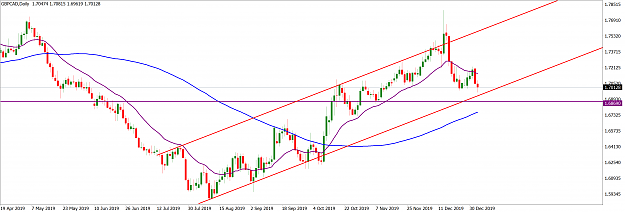
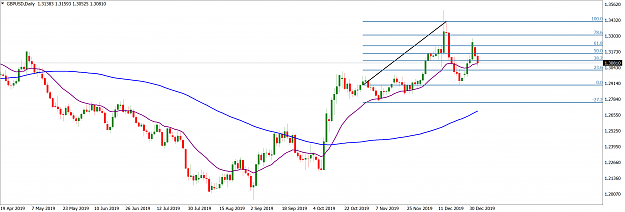
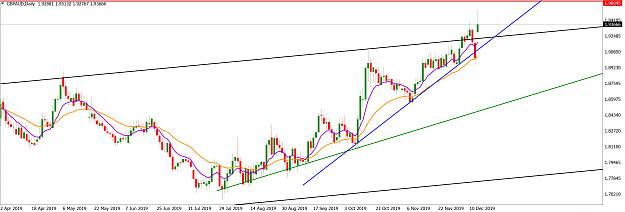
On the daily time frame, market operation has seen an increase in bullish momentum since price action rejected an outer rising trendline (green) traceable to July 2019 to respect an inner rising trendline (blue) from more recent higher lows. The candlestick printed last week Friday broke and closed above the rising channel (black) seen on the weekly time frame. However, its upper shadow is an indication of a weakness in bullish momentum. But, should there be a bullish follow through in the early part of this week, the 1.96050 area (red) is a potential horizontal resistance.
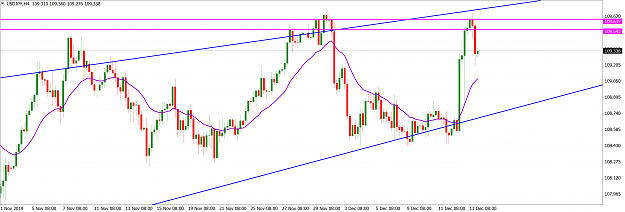
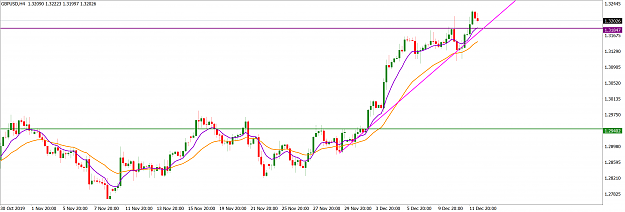
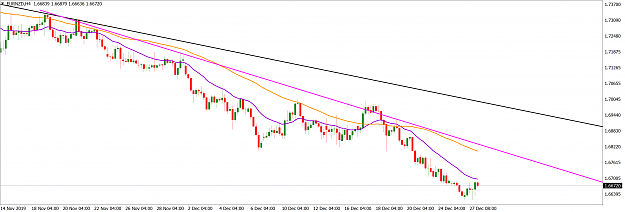
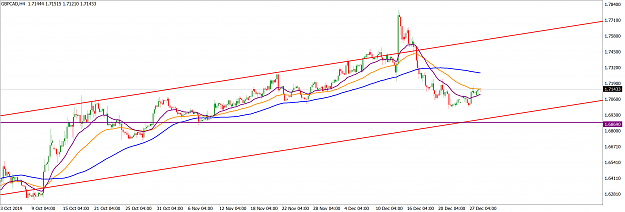
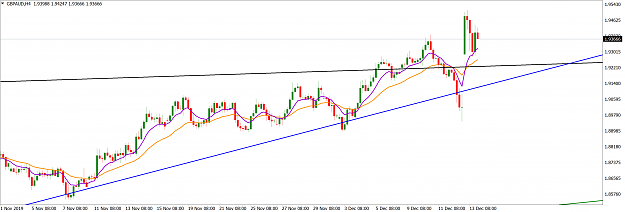
The H4 time frame shows a northward gap of price action above the inner trendline (blue) seen on the daily time frame owing to the UK General election. A bearish correction was being initiated immediately after the election but we have to await the early part of this week for clarity of price action.
I may be wrong. Trade safe and prosper.
KP
The GBPAUD market is disposed northwards. On the weekly time frame, market operation is within a rising channel (black) and bulls are heading towards the channel resistance trendline. The bullish candlestick printed last week nestled at the channel resistance trendline but ended up with shadows at both ends. Should bulls breach the channel resistance trendline northwards, they will have to contend with the 1.96050 horizontal resistance area.
Attached Image (click to enlarge)
On the daily time frame, market operation has seen an increase in bullish momentum since price action rejected an outer rising trendline (green) traceable to July 2019 to respect an inner rising trendline (blue) from more recent higher lows. The candlestick printed last week Friday broke and closed above the rising channel (black) seen on the weekly time frame. However, its upper shadow is an indication of a weakness in bullish momentum. But, should there be a bullish follow through in the early part of this week, the 1.96050 area (red) is a potential horizontal resistance.
Attached Image (click to enlarge)
The H4 time frame shows a northward gap of price action above the inner trendline (blue) seen on the daily time frame owing to the UK General election. A bearish correction was being initiated immediately after the election but we have to await the early part of this week for clarity of price action.
Attached Image (click to enlarge)
I may be wrong. Trade safe and prosper.
KP
Do your homework, follow the footprints of smart money