Hi Yarek, welcome!
I see that you're starting understanding something about Volman price action reading, but there are a couple of things that I'd like to recommend you.
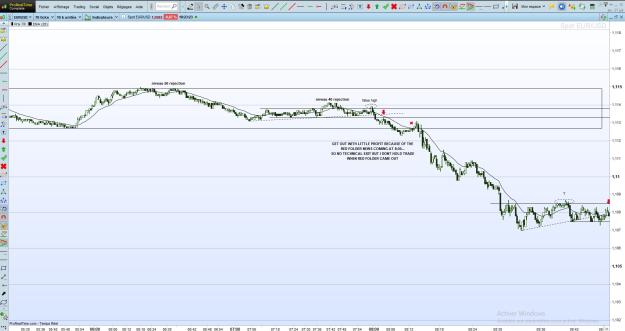
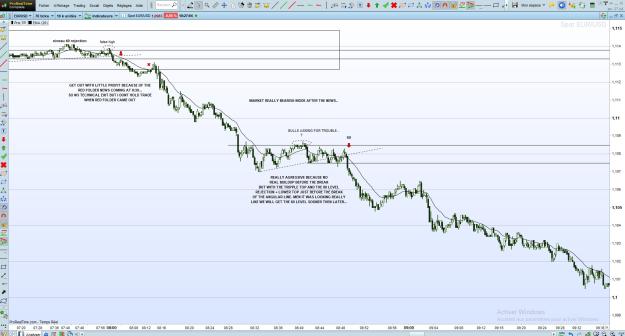
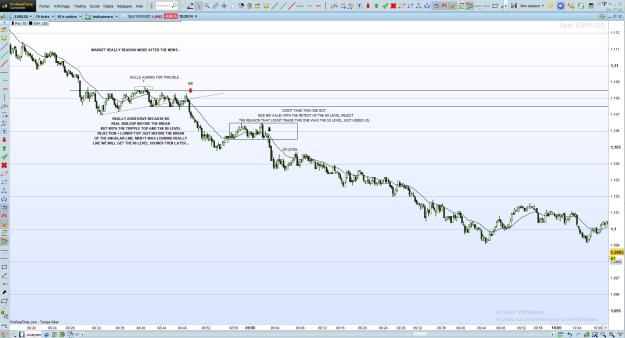
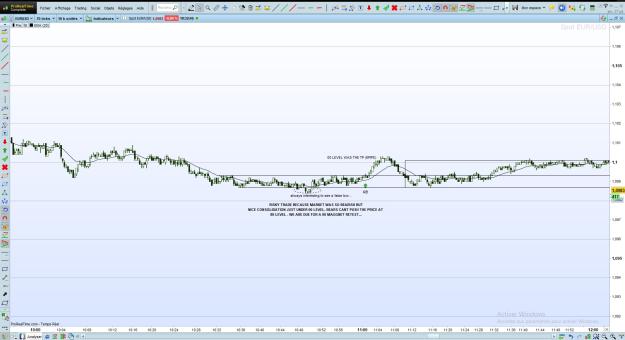
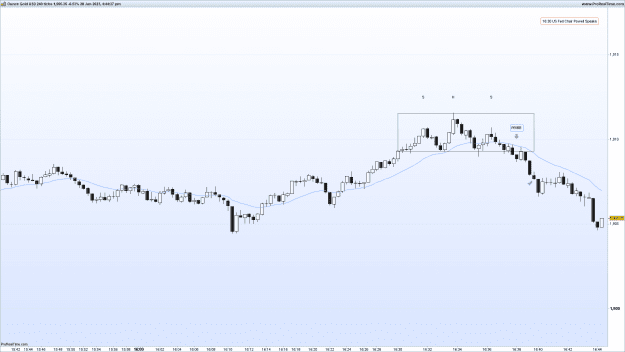
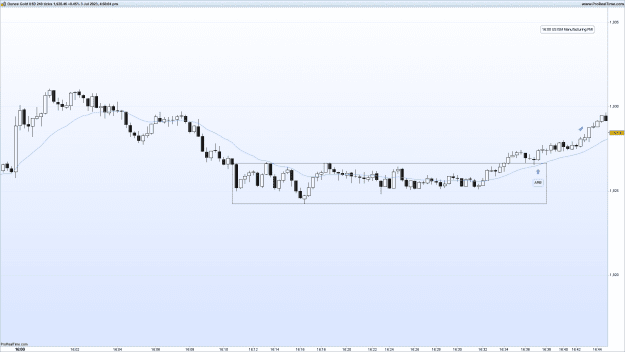
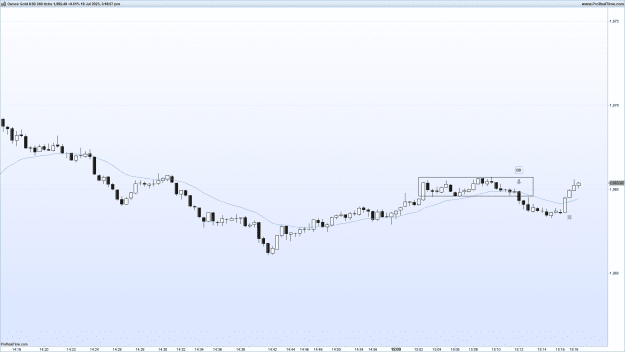
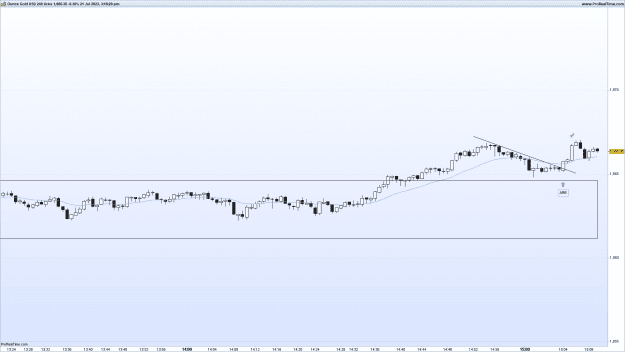
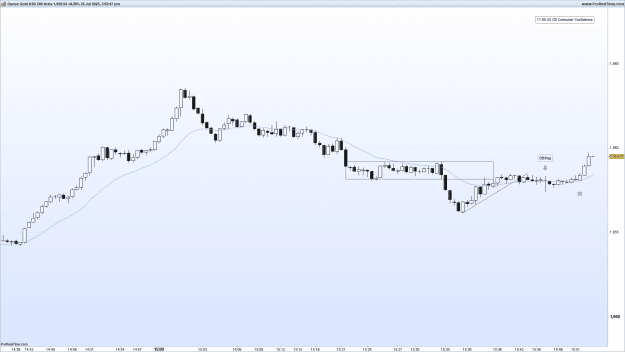
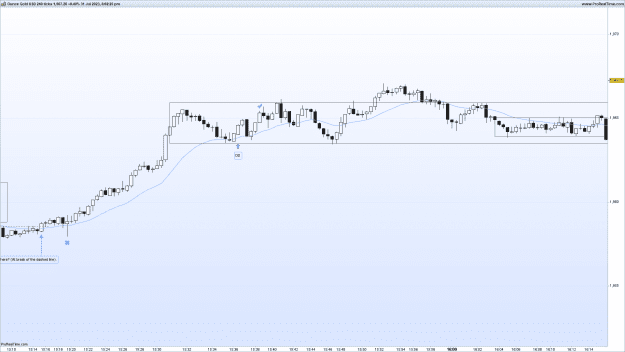
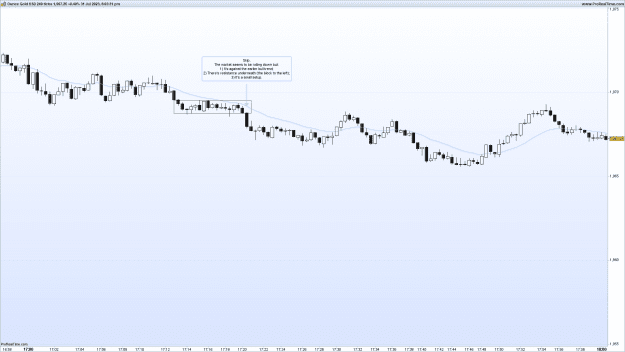
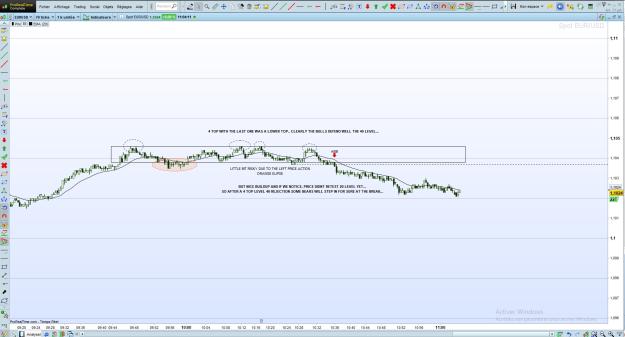
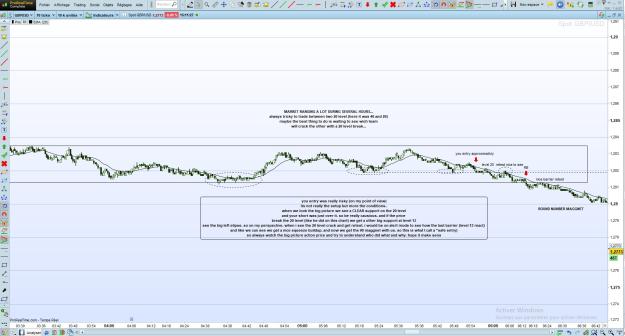
First of all, I suggest you to look at the price action from a bigger picture and considering "bigger setups". For example, the setup in the last picture is a small block, I wouldn't call it a range (and therefore not a RB). Similarly for the other blocks you posted, most of the time, they're not reliable as they're too small (it depends on the case, though).
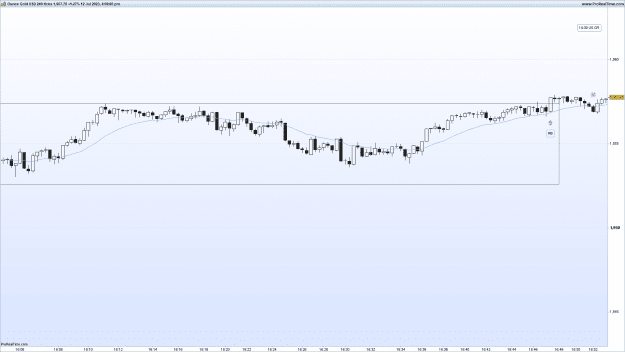
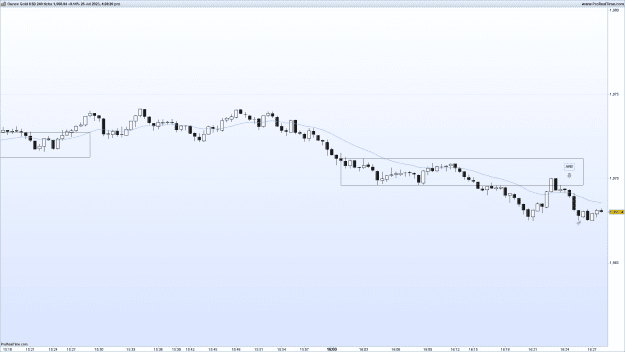
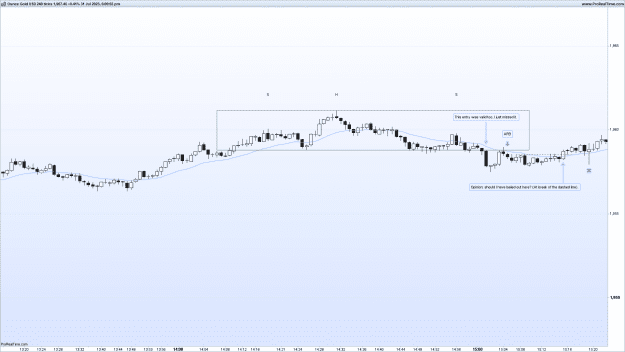
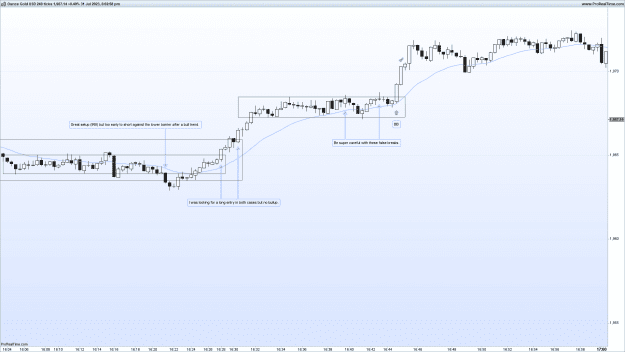
As for the trend entries, in the fist picture (the FB) I don't see any trend to begin with, the market was basically ranging with some strong moves inside. Moreover, in that moment, the trade was against the quite strong bearish move. The FB in the third picture is instead in line with the pressure (and here the trend is in place) but maybe a little aggressive at that point.
In general, as I said, I recommend you to analyze the charts from a slightly bigger point of view. Maybe you can also squeeze the vertical scale a little so not to get tricked by any moves which look like the beginning of trend, when the vertical scale is not squeezed. I personally keep 100 pips on the vertical scale and about 200 bars (or 1.5-2 hours) on the horizontal one, but you better find the settings you prefer.
Moreover, I suggest you to have a look and study the charts posted by Volman in the shared Dropbox folder, as they're very important and "complete" the book. Here's is the link:
https://www.dropbox.com/sh/1amxmi9af...b3Pb_rN3EWA68a
Keep going, most of your analysis is good, you just need to slightly change your point of view and focus on the significant moves of the chart!
I see that you're starting understanding something about Volman price action reading, but there are a couple of things that I'd like to recommend you.
First of all, I suggest you to look at the price action from a bigger picture and considering "bigger setups". For example, the setup in the last picture is a small block, I wouldn't call it a range (and therefore not a RB). Similarly for the other blocks you posted, most of the time, they're not reliable as they're too small (it depends on the case, though).
As for the trend entries, in the fist picture (the FB) I don't see any trend to begin with, the market was basically ranging with some strong moves inside. Moreover, in that moment, the trade was against the quite strong bearish move. The FB in the third picture is instead in line with the pressure (and here the trend is in place) but maybe a little aggressive at that point.
In general, as I said, I recommend you to analyze the charts from a slightly bigger point of view. Maybe you can also squeeze the vertical scale a little so not to get tricked by any moves which look like the beginning of trend, when the vertical scale is not squeezed. I personally keep 100 pips on the vertical scale and about 200 bars (or 1.5-2 hours) on the horizontal one, but you better find the settings you prefer.
Moreover, I suggest you to have a look and study the charts posted by Volman in the shared Dropbox folder, as they're very important and "complete" the book. Here's is the link:
https://www.dropbox.com/sh/1amxmi9af...b3Pb_rN3EWA68a
Keep going, most of your analysis is good, you just need to slightly change your point of view and focus on the significant moves of the chart!
2