Hi all,
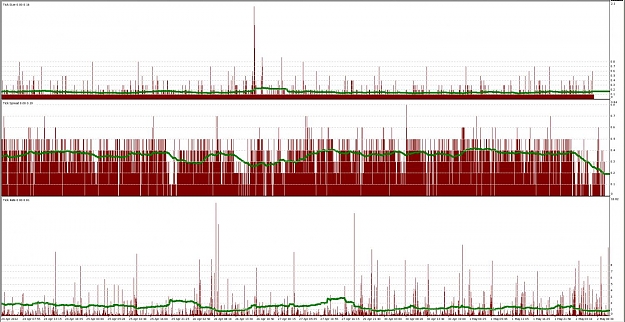
Here are four indicators i made up to display more information about the flow of incoming ticks.
The red histogram values are the values for each tick, and the green lines are the moving averages of the last 100 ticks. The moving average period can be set in the indicator's inputs. The indicators can also be toggled to run on all ticks, or only on ticks where the bid price changes. This compresses the data a little so you get a greater time period in one screen.
The tick spread histogram shows the spread of each tick. The tick size shows the change in bid price between current bid and the previous incoming bid. The tick rate histogram shows the number of seconds each tick lasts for, the moving average shows the average number of incoming ticks per second. Global Variables are set for each of the MA's current value, so they can easily be imported by other indicators/scrips/ea's.
The tick logger records date (column a), server time (b), bid (c), ask (d), bid price change from last tick (e), ask price change from last tick (f), spread (g), and the number of milliseconds until the next tick arrived (h). You must first create a folder called "Tick Log" in your MT4/experts/files folder first.
I have found these tools very useful when it comes to brøker comparisons, as they give detailed information about the their price feed. They are particularly useful at news times, as the indicators show the tick for tick values, as well as moving averages.
Attached File(s)

