• Home
  • Forums
  • Trades
  • News
  • Calendar
  • Market
  • Brokers
  • Login
  • Join
  • User/Email: Password:
  • 7:28pm
Menu
  • Forums
  • Trades
  • News
  • Calendar
  • Market
  • Brokers
  • Login
  • Join
  • 7:28pm
Sister Sites
  • Metals Mine
  • Energy EXCH
  • Crypto Craft

Options

Bookmark Thread

First Page First Unread Last Page Last Post

Print Thread

Similar Threads

Volman Style (70-tick chart) 238 replies

Understanding Price Action by Bob Volman (notes and examples) 96 replies

Multi time frame price action channel (mtf pac) 148 replies

Price Action Channel 14 replies

  • Trading Discussion
  • /
  • Reply to Thread
  • Subscribe
  • 25
Attachments: The Dissent Channel: Volman Price Action
Exit Attachments

The Dissent Channel: Volman Price Action

  • Last Post
  •  
  • Page 1 2
  • Page 1 2
  •  
  • Post #1
  • Quote
  • First Post: Edited May 25, 2022 3:58pm Mar 24, 2021 2:07pm | Edited May 25, 2022 3:58pm
  •  trinidad316
  • | Joined Sep 2019 | Status: Member | 29 Posts
Forum Purpose:
Purpose of this forum is to create a community of "dissenters" that can respectfully discuss differences of opinion on pure Price Action Trade Developments based on Bob Volman's Trading Strategies (references listed below).

Anyone who studies trading long enough will soon come to terms with the fact that the Outcomes are Independent from Decisions.
I won't give a long discussion on the two modes of thinking but its important to understand that we have a Deliberate and a Reflexive thought process that we use to make Decisions Under Uncertainty. This makes us exceptionally skilled at creating "out of the air" biasedness. The question then arises, "How do we reduce these cognitive risks that bleed into our decision making process? "

"Fielding Outcomes" is a critical skill that directly contributes to your skill level as you learn to delineate skill and luck; giving light to the understanding that the probability distribution is not binary but instead a wide spectrum ranging from 0-100%

Consider this forum as a center of Accountability, where the intent is to shed light into your decision making process, reduce biasedness, and "encourage" Truth-seeking by way of discussion.

I am not here to argue statistics as these distribution (& strategy) themselves are subjective but similar to a poker player the intent must be made to give an accurate approximation of the probability with the limited information you have at hand.

By discussing these probabilities the brain will become accustomed to seeking out the truth behind the facts instead of succumbing to weaknesses such as confirmation bias and motivated reasoning. This is part of the process of becoming a "mechanical trader"

Forum Rules:
-Respect first and foremost - this channel is built on a feedback loop thus you should be able to give and take criticism
-Aim to accompany each post with screenshot (win or loss), BOTH opposing and supporting views, and what you feel is an accurate probability.
-Lets keep it a pure Bob Volman Price Action Discussion

Thank you in advance for participating.

References

Technical:


  1. Understanding Price Action
  2. Price Action Scalping


Psychology

  1. Thinking Fast & Slow
  2. Thinking in Bets
  3. Trading in the Zone


****The Documents are outdated and will be updated accordingly - 05/25/22

Attached Files
File Type: pdf Execution Handbook.pdf   86 KB | 384 downloads | Uploaded Mar 28, 2021 3:21pm
File Type: pdf Study Guide - V2.0.pdf   234 KB | 337 downloads | Uploaded Mar 28, 2021 3:21pm
File Type: pdf Trading Strategy.pdf   69 KB | 427 downloads | Uploaded Mar 28, 2021 3:21pm
  • Post #2
  • Quote
  • Mar 28, 2021 3:50pm Mar 28, 2021 3:50pm
  •  trinidad316
  • | Joined Sep 2019 | Status: Member | 29 Posts
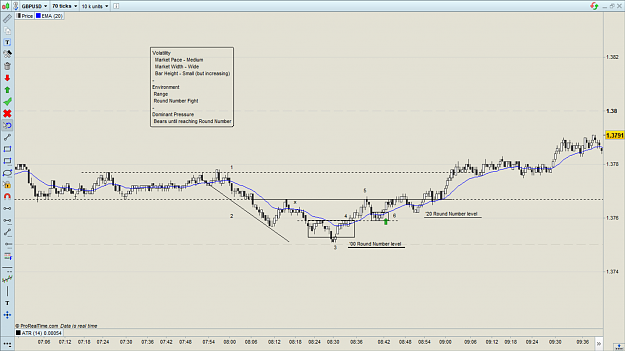
Greetings - I am still relatively new at illustrating my points but here is the best shot of me given this trade justification and its associated probability. If you have a suggestion as to how I can improve or provide more clarity let me know especially the boatload of information available in 1 Chart.

Conditions
--------------------------------------------------------------------------------------------------------------------------------------------------------------------------------
Overall the conditions highlighted by the volatility promoted a healthy trading environment with an increasing wide market width. Price action was expanding as noted by the US Open).

The environment truly gave the feel of a range (no trend in place) so its important to keep perspective and practice caution when trading for continuation

Also on quick scan you notice that the market was really grasping (& failing) at the '50-'60 round number levels which gave you the feeling of a reversal.

Narrative Headlines
--------------------------------------------------------------------------------------------------------------------------------------------------------------------------------
The bear break @ 1 was an extended move that originated well with in a range but did not really have much substance (or technical justification). The lack of a proper break gave a sense of sketchiness to any continuation play and perhaps opening the door for a potential reversal later on.

As you can see by the long extended move @ 2 there was really no cluster backing up the bearish charge which made them extremely vulnerable for an upwards attack. Despite all this, the bears managed to rally off of a second break @ X but failed miserably to capture the obvious '50 round number @ 3.This was a strong clue to obtain that the bears were not as powerful as the structure led on. The bulls took this weakness and immediately rallied as noted by the forceful swing back up (Note also the gap a few bars after @ 3 ).

Quickly they set up an attack of their own and setup a really tight 3 bar squeeze (@ 4) above the EMA which broke upwards powerfully back to the original S/R level (@ 5). The bears felt this a good place to retry their luck and immediately fired short however they were up against a rather long bull swing (@3-5) and a tight cluster @ 4. Price once again aggregated near the top of the former breakout box, at the base of the round number, which also set up as pr @ 6. Note that this trade can be seen as PR or an IRB-Breakout.

Considering the extent of the Rally, it was important to note that Trend=Trend Principle (or Pole-Flag Swing Priniciple) also gave a potential for a sizeable second leg upwards

Entry Conditions
--------------------------------------------------------------------
The entry had a strong technical backing of the '20 Round number and the cluster @ 4. More so it was clearly a S/R which could protect price in case of a turnaround (excellent spot for a tipping point exit).

On the negative end there was a S/R level directly in front of the trade @ 5 but considering the HH (@X-5) it was probable that the bulls were on to make another HH
The set up itself was also loosely defined as the set up did not include any pre-breakout tension which is a usual requirement for this strategy.

Summary
------------------------------------------------------------------------
In summary this was a healthy yet aggressive trade. The markets structure pointed South but the narrative and recent pressure pointed North. The lack of origins and obstructions from the @1-3 swing really set this trade up for a couple more points on the likelihood scale. The excellent entry conditions also added a sense of favorability as explained earlier. Given all the evidence I am comfortable giving this trade a health 60% Likelihood of reaching target. Not the best trade and definite aggressive considering the conflicting information.

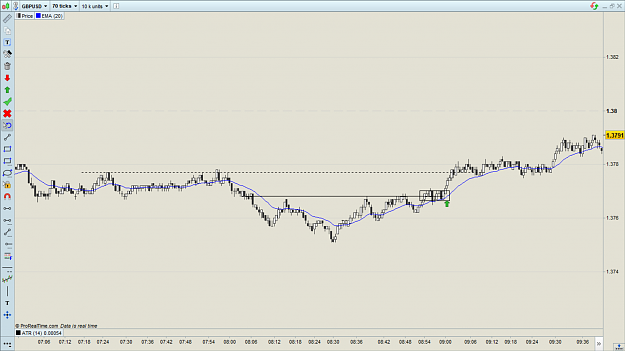
Sometimes a bit more patience can give you a better set up as noted by the ARB in the second screenshot
Attached Images (click to enlarge)
Click to Enlarge

Name: Trade  1.png
Size: 241 KB Click to Enlarge

Name: Alternative ARB.png
Size: 182 KB
 
1
  • Post #3
  • Quote
  • Jun 12, 2021 1:04am Jun 12, 2021 1:04am
  •  cheewnn
  • | Joined Nov 2018 | Status: Junior Member | 1 Post
Hi, I have recently finished reading volman's scalping book and have just started trading with it. Decided to start with some demo account trades to test out the strategy and whether it suits me. First 2 days of trading it has been good though.

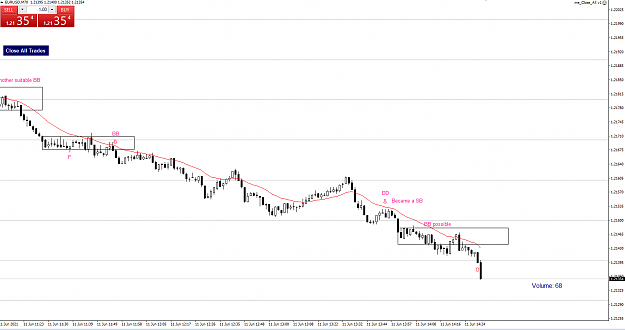
First DD set up. trailed to the bottom of the lower low formed and got stopped out for -1.2 pips
Attached Image (click to enlarge)
Click to Enlarge

Name: 3a47d2616db67c790d1fc1b7229b4c4c.png
Size: 29 KB

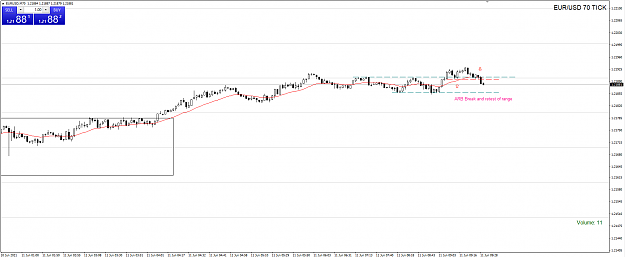
ARB set up. Not too good. Realised the break could have been more extensive to be considered a break and retest type of ARB. -2.7 pips
Attached Image (click to enlarge)
Click to Enlarge

Name: 9287e6cbc1270eaa178ee558a7d7814a.png
Size: 30 KB

BB. Break off the block but was 1 pip away from TP before reversing on my and hitting my tipping point stop. +3.7 pips.
Attached Image (click to enlarge)
Click to Enlarge

Name: 75b44fe7335d83936cc25c805beb454e.png
Size: 29 KB

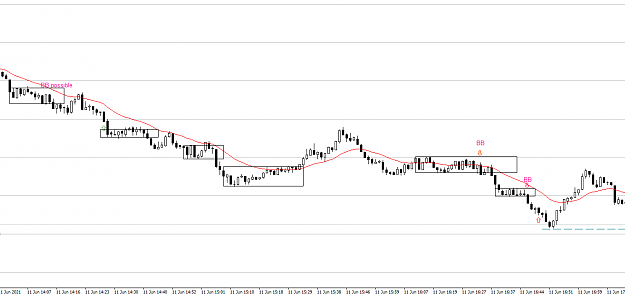
DD into a SB. On hindsight, the DD looked a bit too aggressive as the signal dojis were at least 3 pips apart from top to bottom and i should have waited for an SB for this trade. Was fortunate that this trade worked out. +10pips
Attached Image (click to enlarge)
Click to Enlarge

Name: 2a5b81dcc37806e1f907a02c0ce04099.png
Size: 31 KB

BB. Only took the first BB as the second BB set up during the first BB trade. +10pips
Attached Image (click to enlarge)
Click to Enlarge

Name: b3fbf82f3cfd91594977d8f9f67d2e88.png
Size: 15 KB

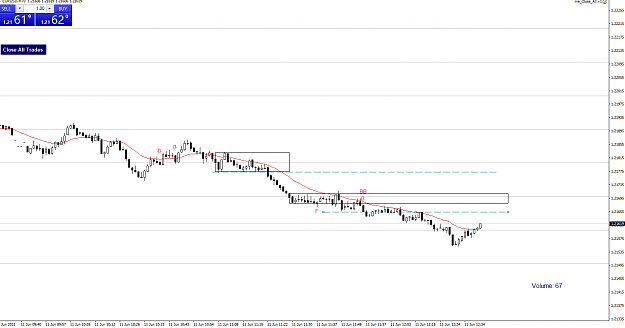
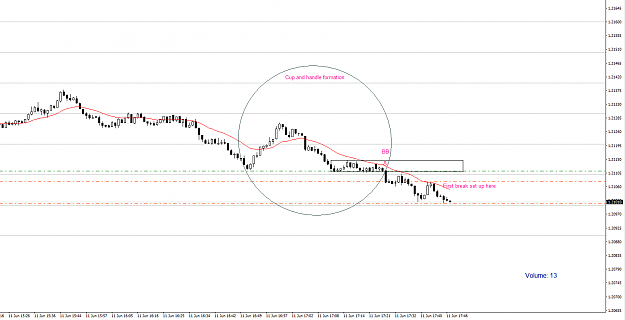
BB set up again on a nice downtrend. Saw the nice cup and handle formation and pressure building up in the block together with 8 candles hitting the floor of the block before breakout. +10pips.
Attached Image (click to enlarge)
Click to Enlarge

Name: bed2110de4cb06fef86a318961ed8991.png
Size: 24 KB


Im using MT4 with an EA that converts the M1 chart into a 70 tick chart. Cheers
 
 
  • Post #4
  • Quote
  • Sep 26, 2021 12:21am Sep 26, 2021 12:21am
  •  Hardandsmart
  • | Joined May 2021 | Status: Member | 25 Posts
Quoting trinidad316
Disliked
Greetings - I am still relatively new at illustrating my points but here is the best shot of me given this trade justification and its associated probability. If you have a suggestion as to how I can improve or provide more clarity let me know especially the boatload of information available in 1 Chart. Conditions -------------------------------------------------------------------------------------------------------------------------------------------------------------------------------- Overall the conditions highlighted by the volatility promoted...
Ignored


why you stopped posting on this thread?
 
 
  • Post #5
  • Quote
  • Feb 15, 2022 4:12pm Feb 15, 2022 4:12pm
  •  Skip82
  • | Joined Feb 2022 | Status: Junior Member | 1 Post
Quoting cheewnn
Disliked
Im using MT4 with an EA that converts the M1 chart into a 70 tick chart. Cheers
Ignored
Can I ask which EA are you using? and why don't you use a 4 digts chart?

I am really struggling to find a ea that transform my MT4 chart in 70 tick and 4 digts.

I am trying a trial version of the Renko Chart for MT4 but when I set it in 4 digts the chart looks really bad.

Can anyone help me out pls?

Thank you
 
 
  • Post #6
  • Quote
  • Edited at 3:49pm May 25, 2022 3:29pm | Edited at 3:49pm
  •  trinidad316
  • | Joined Sep 2019 | Status: Member | 29 Posts
Did not follow up on this forum as I had intended but continued to study Bob Volman Method's nevertheless

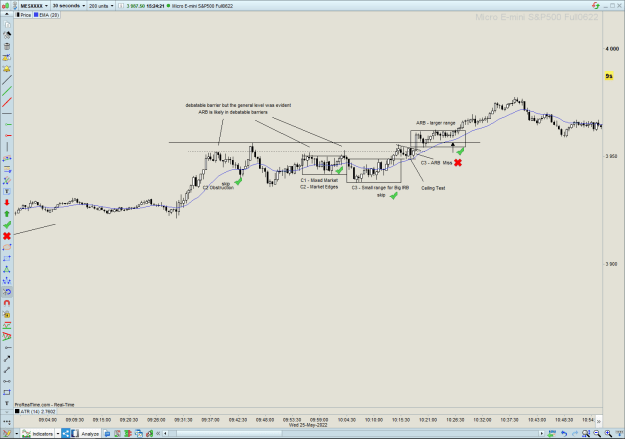
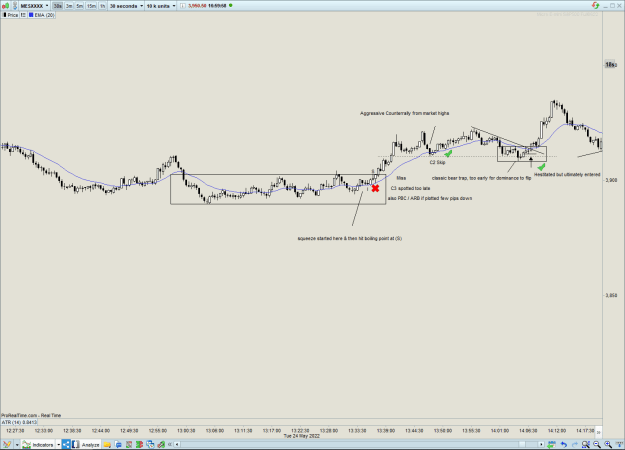
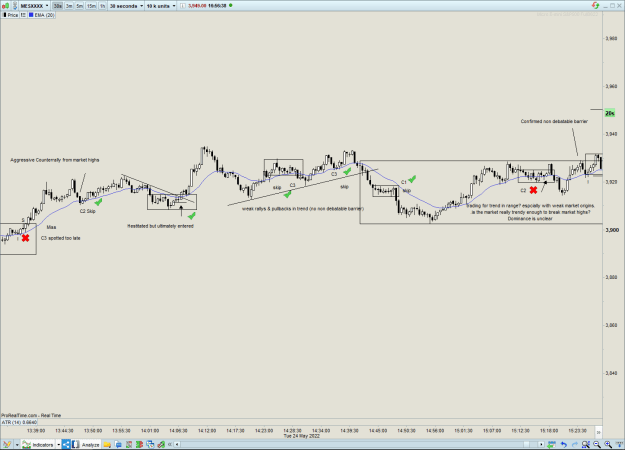
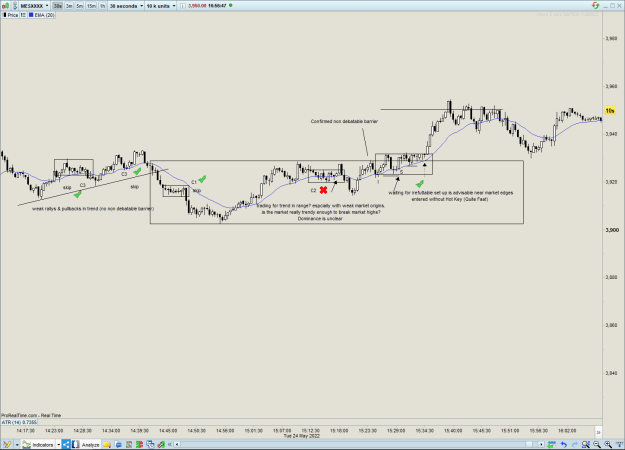
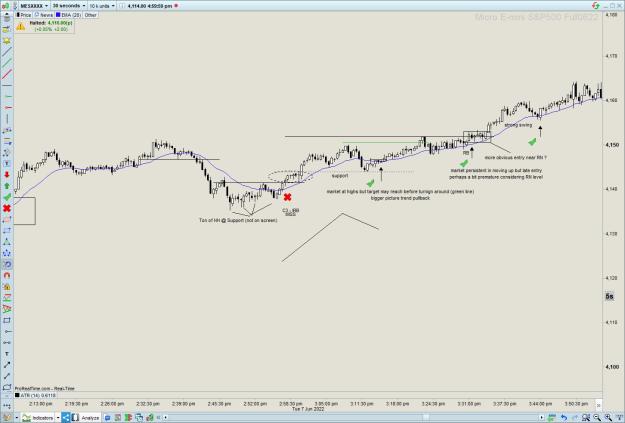
Here's a screenshot of the last two days. Please let me know if you have any questions or looking to collaborate

Please note the following changes to strategy.

  1. Focused on select Price Action Criteria - I was "too keen on trading like the book" (See selected criterion below)
  2. Trading only larger more obvious set ups (not super wide picture though as I originally did)
  3. Dynamic Target (3x ATR)
  4. Trading MES Futures 30 seconds

Strategy Rules:

  1. C0 - Context

    1. Environment
    2. Pace

  2. C1 - Dominant Pressure

    1. Ascending/Descending Highs and Lows
    2. Heavy Chart Support/Resistance

  3. C2 - Counterevidence

    1. S/R Obstructions
    2. Aggressive Counter Rallies
    3. Edge of Market

  4. C3 - Set up

    1. Identification
    2. Pre-breakout Tension

Annotations:

  1. Check Mark is acted correctly
  2. X Mark is acted Incorrectly
  3. Arrow is entry
  4. Black/Red Line underneath Signal Bar is Tipping Point (Often forget to place these)
  5. I - Is Interested (Often forget to place these)
  6. S - Is Signal Bar (Often forget to place these)

Attached Images (click to enlarge)
Click to Enlarge

Name: Screenshot 2022-05-25 152426.png
Size: 29 KB Click to Enlarge

Name: Screenshot 2022-05-24 165109.png
Size: 24 KB Click to Enlarge

Name: Screenshot 2022-05-24 165643.png
Size: 27 KB Click to Enlarge

Name: Screenshot 2022-05-24 165654.png
Size: 27 KB
 
1
  • Post #7
  • Quote
  • Jun 2, 2022 11:02am Jun 2, 2022 11:02am
  •  Hardandsmart
  • | Joined May 2021 | Status: Member | 25 Posts
Do you use all of Bob Volman's scalping setups or only some of them? Also, how do you know if a signal bar has clearly broken, do you see the bar taken out by another bar in the direction as a valid bar break or you use ticks or points to evaluate if a bullish/bearish signal bar has taken out for ex: if price move 2 ticks above a bullish signal bar or by a full point.
 
 
  • Post #8
  • Quote
  • Jun 3, 2022 1:05pm Jun 3, 2022 1:05pm
  •  trinidad316
  • | Joined Sep 2019 | Status: Member | 29 Posts
Quoting Hardandsmart
Disliked
Do you use all of Bob Volman's scalping setups or only some of them? Also, how do you know if a signal bar has clearly broken, do you see the bar taken out by another bar in the direction as a valid bar break or you use ticks or points to evaluate if a bullish/bearish signal bar has taken out for ex: if price move 2 ticks above a bullish signal bar or by a full point.
Ignored

I use only most of Bob Volman Scalping Setups (excluding FB) and variants of his second book which are similar in theory but include more diagonal like setups (represented by lines). I'm working through incoporating other set ups such as the Pattern Break & TFF but they are much less refined.

I eye ball a move passed the signal line but with the speedy conditions its hardly ever a perfect tick. For me any movement in passed the low/high of the signal bar is enough grounds to enter. I;d imagine measuring a full point / half tick etc would be challenging any may cause additional slippage when double pressure kicks in.

What about yourself ? are you a fan of a particular set up in either of his books?

My favorite environment by far are ranges (though ARB diaognals can be difficult). Pullback Reversals - BB are also my bread and butter.
 
1
  • Post #9
  • Quote
  • Jun 3, 2022 1:16pm Jun 3, 2022 1:16pm
  •  trinidad316
  • | Joined Sep 2019 | Status: Member | 29 Posts
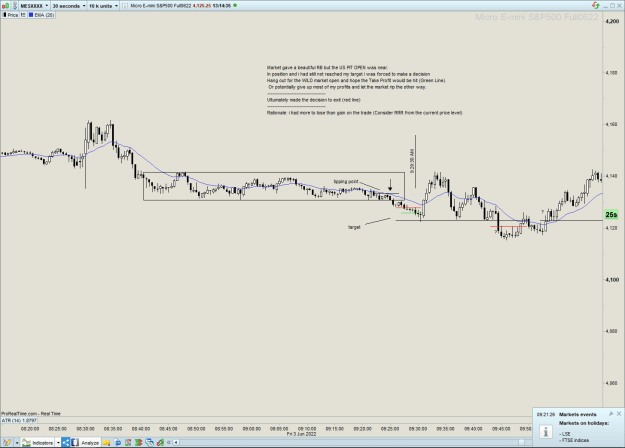
Here is an interesting situation near Market Open. The outcome of the decision I made was unfavorable but was it the right decision.

In hindsight it may look premature but Is it really? Open to feedback. Veteran Play or Premature Action
Attached Image (click to enlarge)
Click to Enlarge

Name: Screenshot 2022-06-03 131442.png
Size: 28 KB
 
2
  • Post #10
  • Quote
  • Jun 6, 2022 11:13am Jun 6, 2022 11:13am
  •  Hardandsmart
  • | Joined May 2021 | Status: Member | 25 Posts
Quoting trinidad316
Disliked
Here is an interesting situation near Market Open. The outcome of the decision I made was unfavorable but was it the right decision. In hindsight it may look premature but Is it really? Open to feedback. Veteran Play or Premature Action {image}
Ignored

Definitely it was a valid exit. May sometime the market open huge volatility works in your favour, the slippage may work in your favour here and there but to stay in a trade near that kind of wild open is sure a tactic of hope and pray. I read about this in Volman book. The chapter was about Exits (news or reversal exits).

As of now I'm demo trading on esmini I am practining scalping and also price action trading on 2min and 5min chart.your style of trading is great.
could you post your pullback reversal, double doji and BB trades more often?
 
1
  • Post #11
  • Quote
  • Jun 6, 2022 11:17am Jun 6, 2022 11:17am
  •  Hardandsmart
  • | Joined May 2021 | Status: Member | 25 Posts
also how much valid trade setups do you get in a session on es mini?
 
 
  • Post #12
  • Quote
  • Jun 7, 2022 7:55am Jun 7, 2022 7:55am
  •  Hardandsmart
  • | Joined May 2021 | Status: Member | 25 Posts
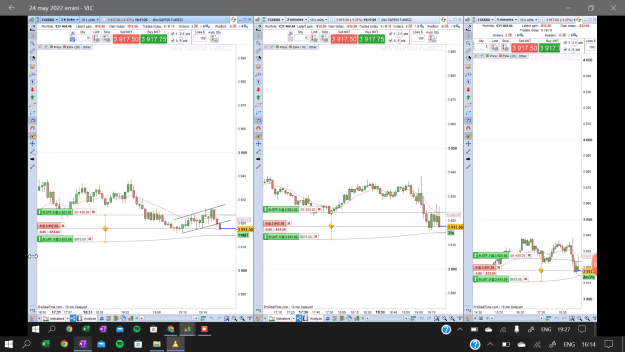
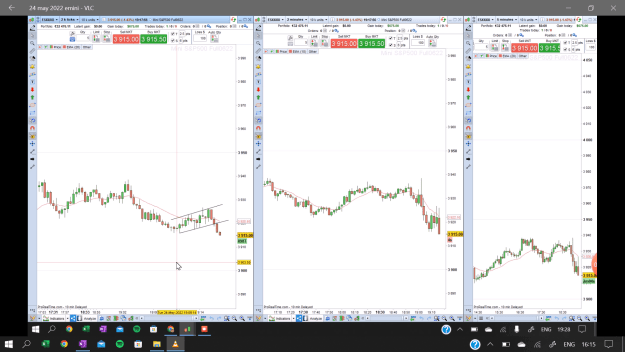
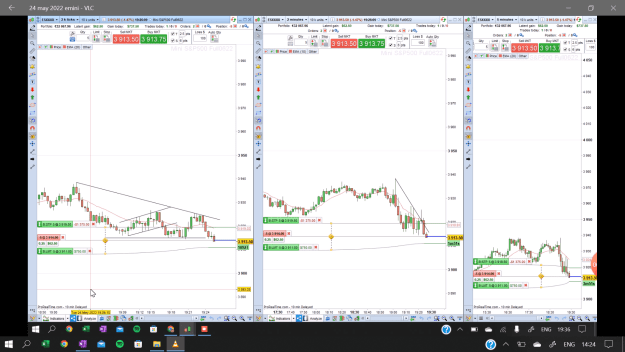
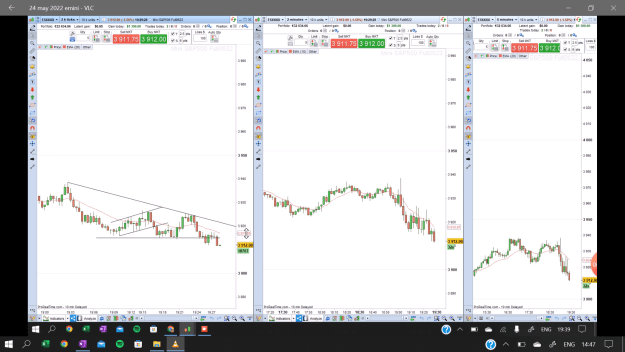
One of my demo trades. At the open. Es-mini.

SHORT (Bullish channel pullback in downtrend break/2min bearish (doji) bar BO in DT)

Attached Image (click to enlarge)
Click to Enlarge

Name: Screenshot (88).png
Size: 232 KB


After the open the market strongly went down on the 2k and 2min chart, the bearish momentum was strong and evident. After four 2min bear bars the market went to test the 10ema 2min chart and on the 2k chart the was also making retracement, the high of the retracement was 50% on the 2k/2min chart. When the retracement was in the making it also made a bull channel on 2k. When the market went below the 20ema and the bar closed on between the 20ema and uptrend line of the bull channel it was signal that the market could go down if it breaks the 1 stuck bearish bar. Also on the 2min chart prices went above the 10ema but strongly closed below it. The first bar that got closed below the average was bearish looking doji with bullish but it showed weakness in the potential of prices up. If this doji breaks by another bar on the 2min it will print a confirm false high also it coincides with the break of bull channel on 2k chart. I entered when the market broke the signal bars by 2 ticks and got target of 2.5 points hit.

Attached Image (click to enlarge)
Click to Enlarge

Name: Screenshot (89).png
Size: 214 KB
 
 
  • Post #13
  • Quote
  • Jun 8, 2022 6:17am Jun 8, 2022 6:17am
  •  Hardandsmart
  • | Joined May 2021 | Status: Member | 25 Posts
SHORT (2min low/session low and strong bearish bar breakout)

Attached Image (click to enlarge)
Click to Enlarge

Name: Screenshot (90).png
Size: 240 KB

From the opening of the session the trend was down. A bearish trend line can be drawn on the descending highs on 2min chart. Prices were well below the moving averages on all charts. On the 2k tick chart a double top got printed in addition to this on 2min chart a bar broke the down trend line but bears pulled the prices strongly making the bar closing below the trendline and 10 ema and that got broken downwards by another bar giving us a false high and also became my signal bar. When that broken to the downside it confirmed the false high even more and also broke the low the current session I entered in the market 2 ticks below the low and got my profit target hit.

Attached Image (click to enlarge)
Click to Enlarge

Name: Screenshot (92).png
Size: 216 KB
 
 
  • Post #14
  • Quote
  • Edited at 6:01pm Jun 8, 2022 5:31pm | Edited at 6:01pm
  •  trinidad316
  • | Joined Sep 2019 | Status: Member | 29 Posts
Quoting Hardandsmart
Disliked
also how much valid trade setups do you get in a session on es mini?
Ignored
So i trade the micro account which is relatively the same set ups as e-mini but I only trade for the first &.or 90 min because of my job. The # of trades in my opinion is relative to the imbalance of pressure. The less of an imbalance the smaller the height of the ranges usually thus the less "swinging" the market would be. Easy way to measure is to see how often the market is breaking considerably away from the EMA (or as I pointed to otherwise the height of the market)

Equity markets have been crazy volatile in the last few months so I usually see about 3-4 Valid Set ups in a 90 min span. I am notoriously conservative so I tend to miss some valid ones but slowly building the skill to trust the odds on some of them. One of my pal's has a more aggressive trading style and he often is able to capitalize on 3-4 in 60 min time (he has trades a BV Variant).

Appreciate the compliment though its a work in progress ! Here are a few trades from yesterday that have a PR-BB & DD
Attached Image (click to enlarge)
Click to Enlarge

Name: Screenshot 2022-06-08 175826.jpg
Size: 155 KB
 
1
  • Post #15
  • Quote
  • Jun 8, 2022 5:42pm Jun 8, 2022 5:42pm
  •  trinidad316
  • | Joined Sep 2019 | Status: Member | 29 Posts
Quoting Hardandsmart
Disliked
One of my demo trades. At the open. Es-mini. SHORT (Bullish channel pullback in downtrend break/2min bearish (doji) bar BO in DT) {image} After the open the market strongly went down on the 2k and 2min chart, the bearish momentum was strong and evident. After four 2min bear bars the market went to test the 10ema 2min chart and on the 2k chart the was also making retracement, the high of the retracement was 50% on the 2k/2min chart. When the retracement was in the making it also made a bull channel on 2k. When the market went below the 20ema and...
Ignored
This is great! Appreciate you sharing your trading styles. I am a fan of using multiple time frames for my analysis but trying to get passed one time frame first so props to you. Ultimately I want to be able to hold my trades longer and understanding that wider narrative will definitely feed that goal

A few questions though, How do you use your multi-frame approach to make decisions. Are you using one for Dominant Pressure as you mentioned above & lowers for exact entries? What context are you using for exits or tipping Point or are these static targets and exits ? Some insight into your trading strategy would be helpful for a healthy convo!
 
 
  • Post #16
  • Quote
  • Jun 8, 2022 5:48pm Jun 8, 2022 5:48pm
  •  trinidad316
  • | Joined Sep 2019 | Status: Member | 29 Posts
Quoting Hardandsmart
Disliked
SHORT (2min low/session low and strong bearish bar breakout) {image} From the opening of the session the trend was down. A bearish trend line can be drawn on the descending highs on 2min chart. Prices were well below the moving averages on all charts. On the 2k tick chart a double top got printed in addition to this on 2min chart a bar broke the down trend line but bears pulled the prices strongly making the bar closing below the trendline and 10 ema and that got broken downwards by another bar giving us a false high and also became my signal bar....
Ignored
definitely some visible tension in the 2 min. I've seen it more as a box though if you squeeze down the y axis. I try to maintain a fixed vantage point of my vertical scale to help my eyes adjust in identifying range and trend. Usually I keep them at '20 point scales unless the market is really active. Do you also follow the same. ?
 
1
  • Post #17
  • Quote
  • Jun 10, 2022 4:22pm Jun 10, 2022 4:22pm
  •  trinidad316
  • | Joined Sep 2019 | Status: Member | 29 Posts
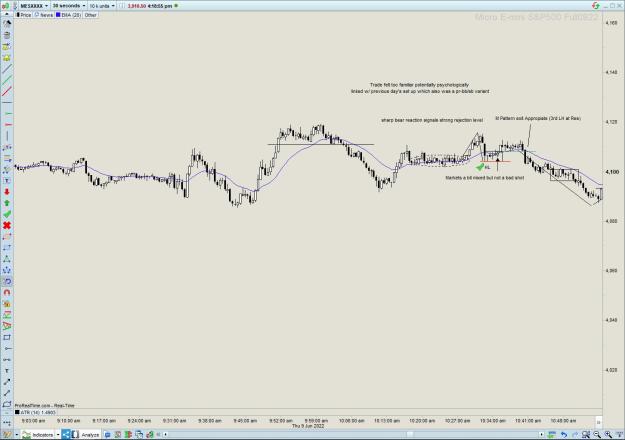
Interesting Potential M Pattern Exit:

Which of the two were correct?

M Pattern Exit (at Green Line)
or Tipping Point Action (at Red Line).

Thoughts?
Attached Image (click to enlarge)
Click to Enlarge

Name: Screenshot 2022-06-10 161905.jpg
Size: 147 KB
 
 
  • Post #18
  • Quote
  • Jun 13, 2022 11:46am Jun 13, 2022 11:46am
  •  Hardandsmart
  • | Joined May 2021 | Status: Member | 25 Posts
Quoting trinidad316
Disliked
{quote} This is great! Appreciate you sharing your trading styles. I am a fan of using multiple time frames for my analysis but trying to get passed one time frame first so props to you. Ultimately I want to be able to hold my trades longer and understanding that wider narrative will definitely feed that goal A few questions though, How do you use your multi-frame approach to make decisions. Are you using one for Dominant Pressure as you mentioned above & lowers for exact entries? What context are you using for exits or tipping Point or are these...
Ignored
Yes I use the 5min timeframe to know dominant party. And try to use that one sided force to scalp on smaller timeframes. But in my analysis I have found only the 5min timeframe works, it don't confuse me that much whereas the 2min timeframe produces a lot of false signals that I end up taking. So know I have exluded the 2min timeframe and use only 5min and 2k tick chart. I have also found 30 second chart very helpful especially when it comes to putting the loss. Talking about my stop losses I use 6 point stoploss but know looking at 30 sec and 2k chart I the stop losses make more sense then it did previously that 30 sec time frame is great frame to choose stop loss yeah you can do that on 2k chart but sometimes it gets very or produce large bars that can make you miss a trade if calculate the stop loss from entry point however on the 30 sec that charting is quiet easy. However I use both charts looking for setups and stoploss. Now also I started to take some swing trades on the 5min as well I have one today I will post it tommorrow.
 
 
  • Post #19
  • Quote
  • Jun 13, 2022 11:48am Jun 13, 2022 11:48am
  •  Hardandsmart
  • | Joined May 2021 | Status: Member | 25 Posts
Quoting trinidad316
Disliked
{quote} definitely some visible tension in the 2 min. I've seen it more as a box though if you squeeze down the y axis. I try to maintain a fixed vantage point of my vertical scale to help my eyes adjust in identifying range and trend. Usually I keep them at '20 point scales unless the market is really active. Do you also follow the same. ?
Ignored
I use 120 points price scale on the 2k and 30 sec and on the 5min time set the price axis to show 200 -250 points.
 
 
  • Post #20
  • Quote
  • Jun 13, 2022 11:57am Jun 13, 2022 11:57am
  •  Hardandsmart
  • | Joined May 2021 | Status: Member | 25 Posts
Quoting trinidad316
Disliked
Interesting Potential M Pattern Exit: Which of the two were correct? M Pattern Exit (at Green Line) or Tipping Point Action (at Red Line). Thoughts? {image}
Ignored
No dount the M pattern exit was the right call because after entering the market, prices just rested on top of the bulidiup making the M pattern in that M pattern we can see 3 distinctive false highs as well now the add the sudden 2 bar bearish down move as well before you took the entry that also technically printed a confirmed false high and lower high. Great call.

Your enteris and exits are all always on point.
 
 
  • Trading Discussion
  • /
  • The Dissent Channel: Volman Price Action
  • Reply to Thread
    • Page 1 2
    • Page 1 2
1 trader viewing now
  • More
Top of Page
  • Facebook
  • Twitter
About FF
  • Mission
  • Products
  • User Guide
  • Media Kit
  • Blog
  • Contact
FF Products
  • Forums
  • Trades
  • Calendar
  • News
  • Market
  • Brokers
  • Trade Explorer
FF Website
  • Homepage
  • Search
  • Members
  • Report a Bug
Follow FF
  • Facebook
  • Twitter

FF Sister Sites:

  • Metals Mine
  • Energy EXCH
  • Crypto Craft

Forex Factory® is a brand of Fair Economy, Inc.

Terms of Service / ©2022