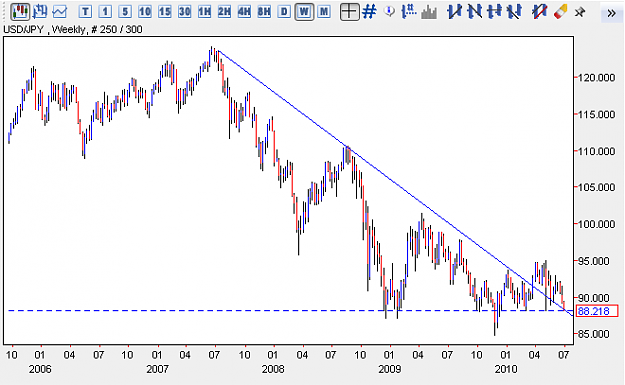
Here are some interesting thoughts (maybe). I decided to pull up the monthly chart so I could see price action from 1993 until today.
1. In June 1995 an uptrend was started.
2. This uptrend lasted exactly 3 years to June 1998 (highest green candle, but 2 months later, price went slightly up before coming down a lot).
3. Current downtrend started July 2007.
4. We are about to enter July 2010, exactly 3 years later.
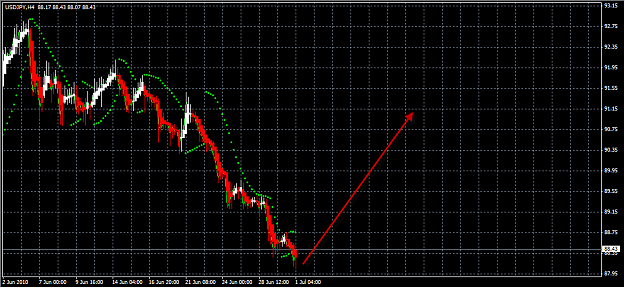
5. Signs of potential leveling off, Japanese "watching" it and sentiment perhaps changing some. Going up?
6. Although, April and June's candles look like what happened in Jan/Feb 1995. The next 2 months, UJ dropped from 97 to 80. Going down?
Anyway, just noticed this today and thought I'd share. Check it out for yourself in case I messed anything up.
Should be fun to watch.
1. In June 1995 an uptrend was started.
2. This uptrend lasted exactly 3 years to June 1998 (highest green candle, but 2 months later, price went slightly up before coming down a lot).
3. Current downtrend started July 2007.
4. We are about to enter July 2010, exactly 3 years later.
5. Signs of potential leveling off, Japanese "watching" it and sentiment perhaps changing some. Going up?
6. Although, April and June's candles look like what happened in Jan/Feb 1995. The next 2 months, UJ dropped from 97 to 80. Going down?
Anyway, just noticed this today and thought I'd share. Check it out for yourself in case I messed anything up.
Should be fun to watch.
Only expectation matters . . .