• Home
  • Forums
  • Trades
  • News
  • Calendar
  • Market
  • Brokers
  • Login
  • Join
  • User/Email: Password:
  • 3:27pm
Menu
  • Forums
  • Trades
  • News
  • Calendar
  • Market
  • Brokers
  • Login
  • Join
  • 3:27pm
Sister Sites
  • Metals Mine
  • Energy EXCH
  • Crypto Craft

Options

Bookmark Thread

First Page First Unread Last Page Last Post

Print Thread

Similar Threads

NZD/JPY Discussion 12 replies

long eur/jpy, gbp/jpy, usd/jpy 11 replies

EUR/USD Bollinger Band Discussion 3 replies

USD/JPY Discussion 4 replies

Suidster's GBP/JPY Discussion 19 replies

  • Interactive Trading
  • /
  • Reply to Thread
  • Subscribe
  • 16,175
Attachments: USD/JPY Discussion
Exit Attachments
Tags: USD/JPY Discussion
Cancel

USD/JPY Discussion

  • Last Post
  •  
  • 1 41394140Page 414141424143 4332
  • 1 Page 4141 4332
  •  
  • Post #82,801
  • Quote
  • May 25, 2020 6:15am May 25, 2020 6:15am
  •  markofrose
  • | Joined Aug 2017 | Status: Member | 110 Posts
Still holding my short since last month..
 
1
  • Post #82,802
  • Quote
  • May 25, 2020 12:03pm May 25, 2020 12:03pm
  •  istanbulfx
  • | Joined May 2020 | Status: Member | 1 Post
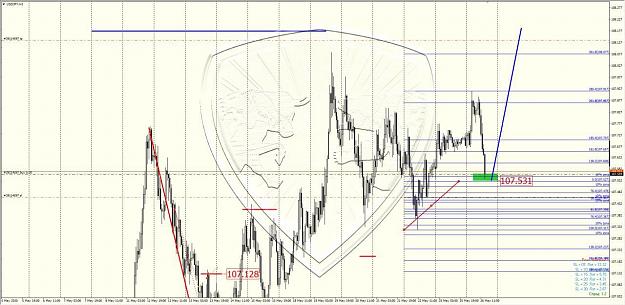
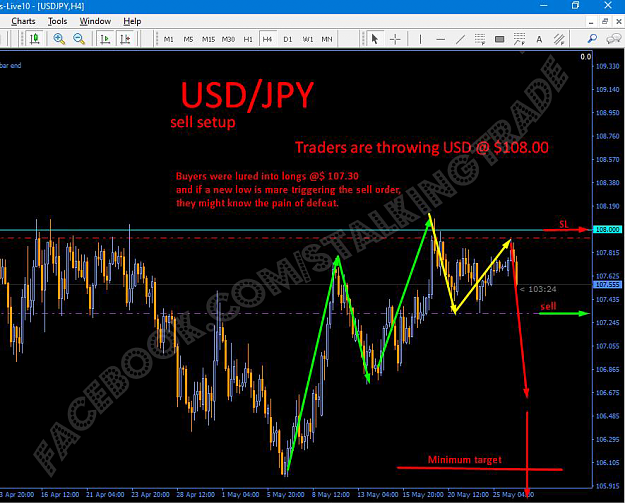
i think usddjpy wait news... go up 108.95
 
 
  • Post #82,803
  • Quote
  • May 25, 2020 1:39pm May 25, 2020 1:39pm
  •  WizardTrade
  • Joined Apr 2020 | Status: Ready to Lose Again | 1,252 Posts
Broke-even on this pair. Will be catching up another move again. Trade Safe.
WARNING: This post warps space and time in its vicinity.
Challenge $100 to $12K - Starts 26 Sep All Time Return: -11.3%
 
 
  • Post #82,804
  • Quote
  • May 26, 2020 7:23am May 26, 2020 7:23am
  •  LifeTrading
  • | Joined Mar 2020 | Status: Member | 103 Posts
Attached Image (click to enlarge)
Click to Enlarge

Name: photo_2020-05-26_14-22-46.jpg
Size: 122 KB
 
 
  • Post #82,805
  • Quote
  • May 26, 2020 7:24am May 26, 2020 7:24am
  •  andoseg2
  • Joined Jun 2011 | Status: Swing trader using Market Cycles | 2,146 Posts
Attached Image (click to enlarge)
Click to Enlarge

Name: photo_2020-05-26_14-19-43.png
Size: 377 KB
Money moves the market, not an indicator.
 
 
  • Post #82,806
  • Quote
  • May 26, 2020 12:36pm May 26, 2020 12:36pm
  •  tehnoob
  • Joined Apr 2020 | Status: Member | 478 Posts
Quoting tehnoob
Disliked
{quote} Yes something like this. I'd prefer the engulfing candle to be larger in relation to those to its left, and for it to be at the top of a longer uptrend than the one I can see in the photo, and I'd prefer it to be at or near an important level, like a previous day/week/month high, range high , or smth like that. The more choosy you become, the less opportunities that you can take, but the deadlier you accuracy I expect USD/JPY to still take out those highs above 108.20ish but may it will languish around here and there for a week, then maybe...
Ignored
As my puffer fish suspected, this pair has been languishing in a tight range for days now, after the initial bullish fak...sorry, I mean breakout!

But, I reckon it is now only a few days away for that final lethal SPIKE north heheh
Attached Image (click to enlarge)
Click to Enlarge

Name: USDJPY spike time.jpg
Size: 119 KB
 
 
  • Post #82,807
  • Quote
  • May 26, 2020 1:15pm May 26, 2020 1:15pm
  •  OBsayMkMoney
  • Joined Jan 2019 | Status: Member | 1,826 Posts
Quoting tehnoob
Disliked
{quote} As my puffer fish suspected, this pair has been languishing in a tight range for days now, after the initial bullish fak...sorry, I mean breakout! But, I reckon it is now only a few days away for that final lethal SPIKE north heheh {image}
Ignored
Wait... that's not.. a 101 on your chart is it?

My experience is more limited than yours, so let me ask you this. Pull up a 4hr chart. Look at it for the past 18m roughly. The range before we dove down to 101 was a little higher than this current one. Any significance? I ask because my thinking was that the previous range looks like folks loading up for the trip to 101 as it ranged on the high end of the area. This range is on the low end of that value area. I put no stock in this, mind you. Just something I noticed when I stepped back to view things.
When you feel like you HAVE to trade is when you least should!
 
 
  • Post #82,808
  • Quote
  • May 26, 2020 1:37pm May 26, 2020 1:37pm
  •  tehnoob
  • Joined Apr 2020 | Status: Member | 478 Posts
I have found that it's not so much specific levels and zones that matter for trying to predict and catch big moves.

It's more noticing the pattern of movement and matching it to a precedent. Pattern similarity frees you from getting tied to specific numbers and zones too early on.

Half of your posts suggests that you are already doing that. But the other half suggests that you run the risk of locking yourself into specific price levels before it is yet time to do so.

That 101 is not a prediction , I just drew a long aggressive downtrend line for what I suspect will follow after the -also suspected- spike up

Ultimately, it wouldn't surprise me if the USD/JPY wanted to revisit the 90s even. But atm I don't have specific prices levels in mind. I do think the spike up, if it transpires, will probably be around 200 pips
 
 
  • Post #82,809
  • Quote
  • May 26, 2020 1:49pm May 26, 2020 1:49pm
  •  tehnoob
  • Joined Apr 2020 | Status: Member | 478 Posts
I don't know if I made enough sense.

It's the similarity of the character of the price's movement (usually on daily charts) to past periods

that alerts me to the best opportunities. Not the price's movement through/towards or away from specific price levels and zones. I start thinking about price levels after I have become sufficiently convinced that the market is going to try something akin to the past pattern that I think I noticed, and really more so when I am close to taking the trade. But by then I don't need to have predicted a number to enter, because price action at lower timeframes and the day of week + time of day will usually betray the entry level
 
 
  • Post #82,810
  • Quote
  • May 26, 2020 4:07pm May 26, 2020 4:07pm
  •  OBsayMkMoney
  • Joined Jan 2019 | Status: Member | 1,826 Posts
Quoting tehnoob
Disliked
I don't know if I made enough sense. It's the similarity of the character of the price's movement (usually on daily charts) to past periods that alerts me to the best opportunities. Not the price's movement through/towards or away from specific price levels and zones. I start thinking about price levels after I have become sufficiently convinced that the market is going to try something akin to the past pattern that I think I noticed, and really more so when I am close to taking the trade. But by then I don't need to have predicted a number to enter,...
Ignored

Well explained, thank you. You are correct that I am more of a pattern person than numbers. The numbers come second for me. Funny thing I recently realized that since switching to mt4 my grasp of price targets has diminished. I was actually considering an indy to put price on my charts were i would recognize it over the spread being displayed. Coming from thinkorswim I am more accustomed to just the market price showing. Perhaps I stumbled onto something though. My best trades come from me walking past my screens and seeing black cats (Matrix reference lol).

Appreciate you sir.
When you feel like you HAVE to trade is when you least should!
 
 
  • Post #82,811
  • Quote
  • May 26, 2020 4:18pm May 26, 2020 4:18pm
  •  OBsayMkMoney
  • Joined Jan 2019 | Status: Member | 1,826 Posts
This is the Vix. If you notice we are currently just under where we truly took off north heading to that 3/16 drop. Significance? To me this says while calm, the centuries are still patrolling the castle in pairs. 30 is support. If we hit 40, Bohica on deck in my opinion. Something to watch...

Attached Image (click to enlarge)
Click to Enlarge

Name: Image2.png
Size: 286 KB
When you feel like you HAVE to trade is when you least should!
 
 
  • Post #82,812
  • Quote
  • May 26, 2020 5:54pm May 26, 2020 5:54pm
  •  OBsayMkMoney
  • Joined Jan 2019 | Status: Member | 1,826 Posts
Thursday is looking good for a spike and reverse. Important USD news in the morning, and also jpy at night. If BOJ is still crippling their currency, and the US is in the midst of it's issues. Down US market, up Asian? Either way. Watch thursday. Fundamentals give price action excuses to run.

Attached Image (click to enlarge)
Click to Enlarge

Name: Image1.png
Size: 130 KB


Spikes happen between 85 and 93% in my experience. I have alerts for the such.
At 95%+ We range briefly then boom.


Attached Image (click to enlarge)
Click to Enlarge

Name: Image2.png
Size: 15 KB
When you feel like you HAVE to trade is when you least should!
 
1
  • Post #82,813
  • Quote
  • May 26, 2020 6:09pm May 26, 2020 6:09pm
  •  OBsayMkMoney
  • Joined Jan 2019 | Status: Member | 1,826 Posts
NYSE re-opened today. The S&P is back at 3000. Folks are talking about the Dow hitting that all time high again, although I personally only see a 27000 hit. I say all this to say we are almost there. IMO when the Dow starts rejecting those highs, UJ will finally truly start north in a way people other than day traders can get excited about. If history is a lesson those highs will come on the heels of some good news. We are across the 25000 mark, so we don't need much. Just something to go unchallenged for a days or so. We just had earnings, and everyone basically punted the ball downfield. For those of you non Americans... They kept the ball in play. Most put off guidance. Some suspended Dividends. These are things that should come back to bite them in the ass during the second and third quarters. If the previous range is any indication though. We could bounce around these levels for the next couple of months, as we did leading up to the drop to 101. If so, Good news for scalpers, day traders, and trading robots alike! 108.3 the top, and I think 104 the base with room to flush folks out.

If these seems out of sequence.. I wrote this this morning on my work pc and never posted it lol.
When you feel like you HAVE to trade is when you least should!
 
 
  • Post #82,814
  • Quote
  • May 26, 2020 6:18pm May 26, 2020 6:18pm
  •  OBsayMkMoney
  • Joined Jan 2019 | Status: Member | 1,826 Posts
Quoting tehnoob
Disliked
{quote} As my puffer fish suspected, this pair has been languishing in a tight range for days now, after the initial bullish fak...sorry, I mean breakout! But, I reckon it is now only a few days away for that final lethal SPIKE north heheh {image}
Ignored
Weekly chart shows a nice doji at 108.3 area that peaked out at 109.2. Looks good to me for a spike considering all the web chatter about 108.3 being the point of no return. A spike that extends above 108.3 would entice more buyers to jump on board as they will see it as broken resistance. Meanwhile the break may simply form the head of a head and shoulders pattern. I am going to shade the area and watch it.
When you feel like you HAVE to trade is when you least should!
 
 
  • Post #82,815
  • Quote
  • May 27, 2020 2:02am May 27, 2020 2:02am
  •  tehnoob
  • Joined Apr 2020 | Status: Member | 478 Posts
Quoting OBsayMkMoney
Disliked
{quote} Weekly chart shows a nice doji at 108.3 area that peaked out at 109.2. Looks good to me for a spike considering all the web chatter about 108.3 being the point of no return. A spike that extends above 108.3 would entice more buyers to jump on board as they will see it as broken resistance. Meanwhile the break may simply form the head of a head and shoulders pattern. I am going to shade the area and watch it.
Ignored
Such long-legged dojis often give us a target on both sides. The price will seek to take out both the high and the low. First, it will push and smash through one, then it will reverse and go hunt the other extreme of the doji. In a smaller timeframe, you see this often with high-impact news days like NFP.

By the way, the exhaustion of the multi-ear bearish USD/JPY trend was signalled by such a two-month, long-legged doji and, tragically, in a sort of Jungian synchronicity, by the massive earthquake and tsunami of March 2011. If you take March 2011 and the following month of April 2011 together, they formed such a two-month doji. The price then slowly crawled down to take out the bottom of that doji for a bit, then it reversed and has not seen those levels ever since, nor is it likely to
 
 
  • Post #82,816
  • Quote
  • May 27, 2020 8:54am May 27, 2020 8:54am
  •  OBsayMkMoney
  • Joined Jan 2019 | Status: Member | 1,826 Posts
Quoting tehnoob
Disliked
{quote} Such long-legged dojis often give us a target on both sides. The price will seek to take out both the high and the low. First, it will push and smash through one, then it will reverse and go hunt the other extreme of the doji. In a smaller timeframe, you see this often with high-impact news days like NFP. By the way, the exhaustion of the multi-ear bearish USD/JPY trend was signalled by such a two-month, long-legged doji and, tragically, in a sort of Jungian synchronicity, by the massive earthquake and tsunami of March 2011. If you take...
Ignored

Awesome stuff good to know, thanks. I will run it in Demo mode over the next few days to get an idea of how it bumps the edges.
When you feel like you HAVE to trade is when you least should!
 
 
  • Post #82,817
  • Quote
  • May 27, 2020 10:25am May 27, 2020 10:25am
  •  tehnoob
  • Joined Apr 2020 | Status: Member | 478 Posts
Looks at this big, scary, "bearish engulfing" or "bearish outside" candle on the USD/JPY hourly chart, at prior high. Trying sooo hard to convince you to short it, hehe

A bit too hard

More likely to be a bullish sign and a warning bell for the coming spike up
Attached Image (click to enlarge)
Click to Enlarge

Name: USDJPY fake.jpg
Size: 96 KB
 
 
  • Post #82,818
  • Quote
  • May 27, 2020 10:55am May 27, 2020 10:55am
  •  tehnoob
  • Joined Apr 2020 | Status: Member | 478 Posts
Been a good day so far on the indices, so let's put some more capital to work. Long punt taken on USD/JPY. Let's see if it wants to spike up, or take out the day's low

If it survives, I hope it will bear about 200 pips on the long side
Attached Image (click to enlarge)
Click to Enlarge

Name: USDJPY fade long.jpg
Size: 91 KB
 
 
  • Post #82,819
  • Quote
  • Edited 1:41pm May 27, 2020 1:28pm | Edited 1:41pm
  •  OBsayMkMoney
  • Joined Jan 2019 | Status: Member | 1,826 Posts
Hmmmm
Attached Image (click to enlarge)
Click to Enlarge

Name: USDJPY fade long.jpg
Size: 91 KB


Looks an awful lot like this.. no?

Attached Image (click to enlarge)
Click to Enlarge

Name: CupnHandle.png
Size: 31 KB


How to identify the cup and handle pattern,

To identify the cup and handle pattern, start by following the price movements on a chart. The pattern starts to form when there is a sharp downward price movement over a short time. This is followed by a period where the price remains relatively stable. Then, there is a rally that is more or less equal to the initial decline. These movements form a ‘u’ shape on the chart – this is known as the cup.
Once the price has reached the top of the cup, it starts moving sideways or slightly downwards to form the handle. If the handle drops below the lower half of the cup, it is no longer a ‘cup and handle’ pattern. In most cases, the handle should not dip below the top third of the cup for it to be a cup and handle pattern.


Look at all that congestion around the 107.7 area which is right around the 1/3rd mark described above. Days ago an analyst described this pattern as one of the more bullish ones. Let's see. Isn't learning fun?!
When you feel like you HAVE to trade is when you least should!
 
1
  • Post #82,820
  • Quote
  • May 27, 2020 2:53pm May 27, 2020 2:53pm
  •  Swisse
  • Joined Jun 2015 | Status: Member | 102 Posts
Attached Image (click to enlarge)
Click to Enlarge

Name: 5.26.20.png
Size: 78 KB

lol
 
2
  • Interactive Trading
  • /
  • USD/JPY Discussion
  • Reply to Thread
    • 1 41394140Page 414141424143 4332
    • 1 Page 4141 4332
2 traders viewing now, 1 is a member:
Invisible
  • More
Top of Page
  • Facebook
  • Twitter
About FF
  • Mission
  • Products
  • User Guide
  • Media Kit
  • Blog
  • Contact
FF Products
  • Forums
  • Trades
  • Calendar
  • News
  • Market
  • Brokers
  • Trade Explorer
FF Website
  • Homepage
  • Search
  • Members
  • Report a Bug
Follow FF
  • Facebook
  • Twitter

FF Sister Sites:

  • Metals Mine
  • Energy EXCH
  • Crypto Craft

Forex Factory® is a brand of Fair Economy, Inc.

Terms of Service / ©2023