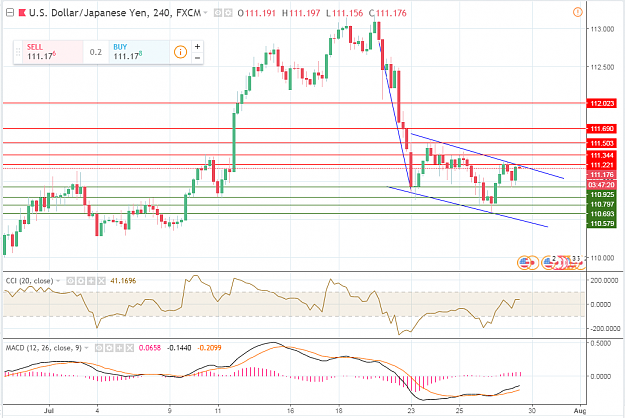
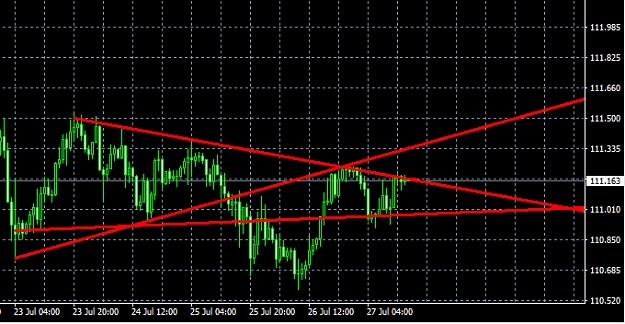
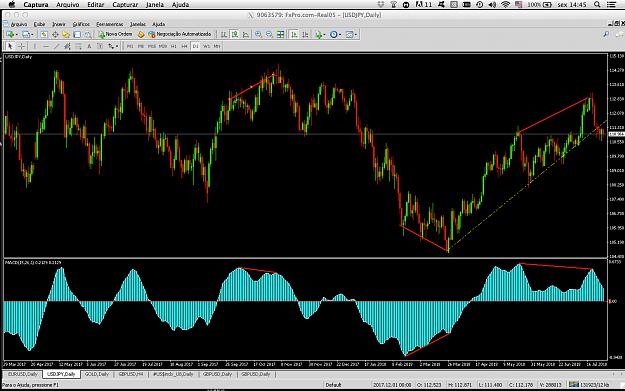
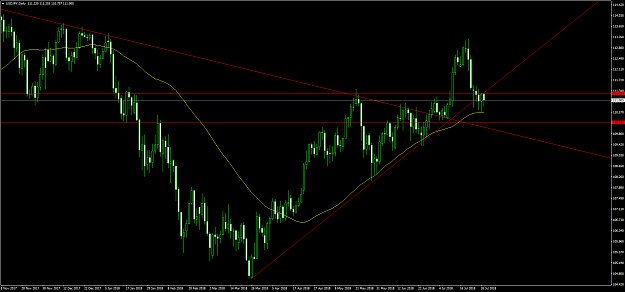
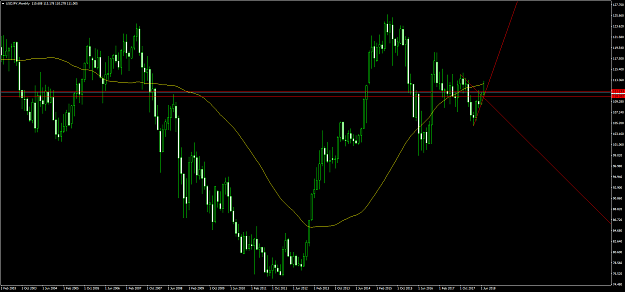
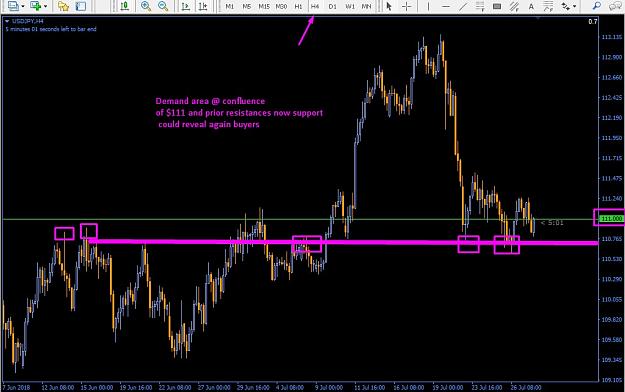
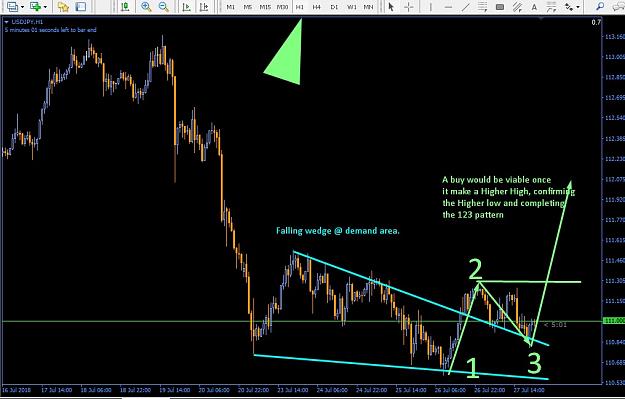
USDJPY is trading above the support level 110.925 and forms a down flag pattern in a technical 4-hour chart. I expect the bullish momentum for next trading hours, pair would face hurdle at first resistance level 111.221 and if it sustains above this level, then it will face second resistance at 111.344. Further mounting pressure will force the pair to climb till level of 111.690 after breaching of third resistance at 111.503. A solid breakout of pattern will make the pair to attain a height of 112.023
If it crosses the support level, then it could get second support at 110.797 and may witness a fall till level of 110.579 after sustenance below third support at 110.693
If it crosses the support level, then it could get second support at 110.797 and may witness a fall till level of 110.579 after sustenance below third support at 110.693
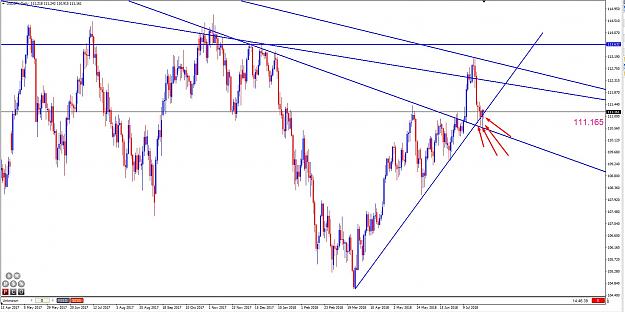
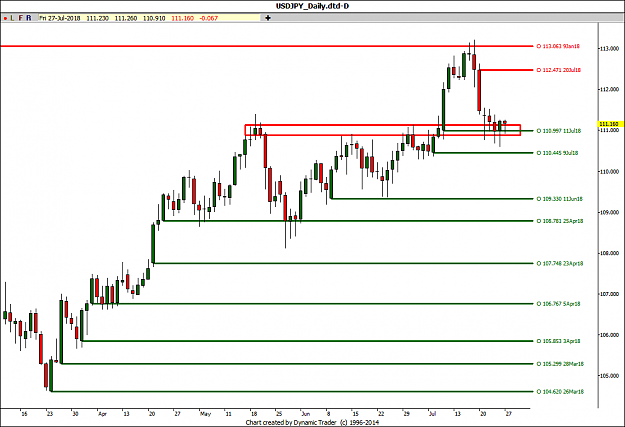
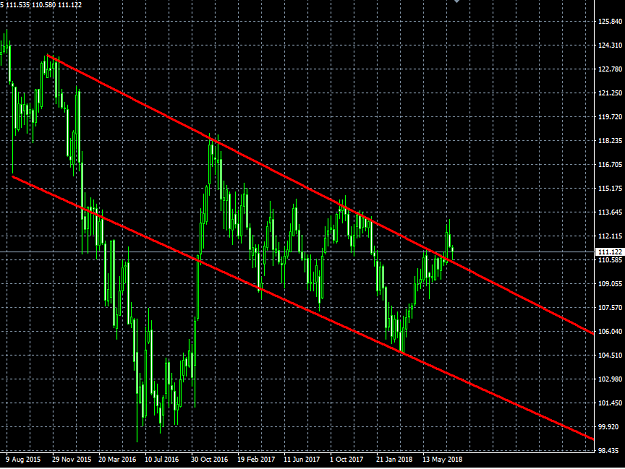
Attached Image (click to enlarge)