• Home
  • Forums
  • Trades
  • News
  • Calendar
  • Market
  • Brokers
  • Login
  • Join
  • User/Email: Password:
  • 11:23pm
Menu
  • Forums
  • Trades
  • News
  • Calendar
  • Market
  • Brokers
  • Login
  • Join
  • 11:23pm
Sister Sites
  • Metals Mine
  • Energy EXCH
  • Crypto Craft

Options

Bookmark Thread

First Page First Unread Last Page Last Post

Print Thread

Similar Threads

Trading Made Simple the right way, and other trading lessons 323 replies

Trading is this Simple? Finally Explained simple and clearly! 45 replies

trading is simple - trading is easy 43 replies

SIMPLE EA for a simple method needed!! 1 reply

Simple trading method 49 replies

  • Trading Systems
  • /
  • Reply to Thread
  • Subscribe
  • 7,631
Attachments: Trading is as simple as 1-2-3
Exit Attachments
Tags: Trading is as simple as 1-2-3
Cancel

Trading is as simple as 1-2-3

  • Last Post
  •  
  • 1 574575576577Page 578 579
  • 1 Page 578 579
  •  
  • Post #11,541
  • Quote
  • Oct 7, 2022 11:20am Oct 7, 2022 11:20am
  •  Chocopie
  • | Joined Oct 2022 | Status: Junior Member | 1 Post
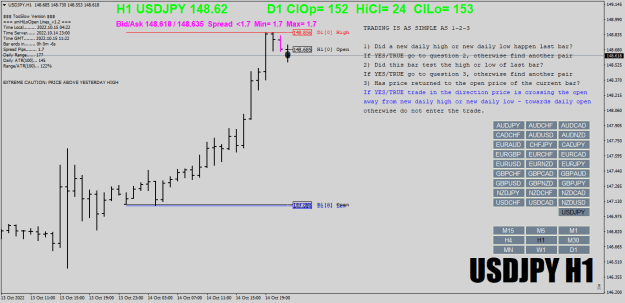
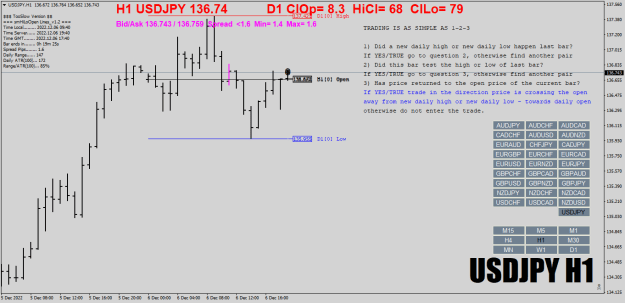
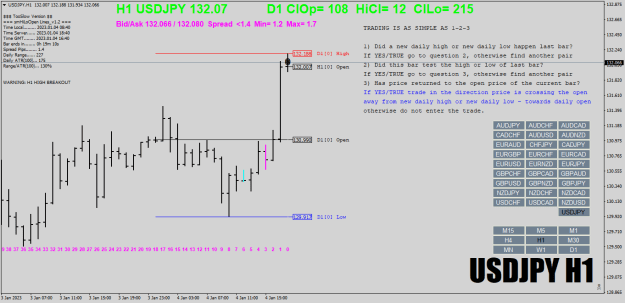
I don't quite understand, so we will entry when bar#0 has not closed yet? If it hasn't closed it is likely to go back to test the top/bottom of bar#1 again. And ít will hit stoploss easily.
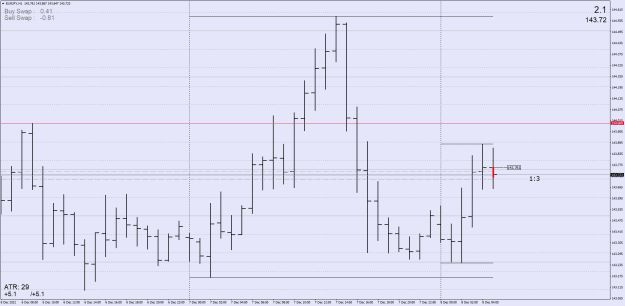
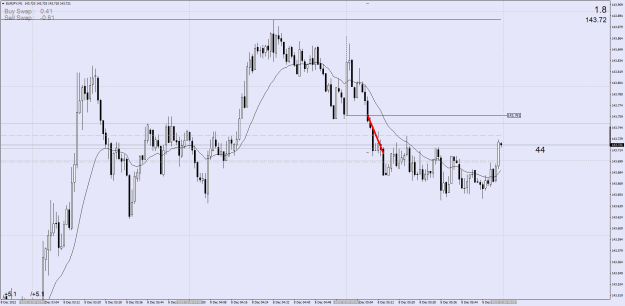
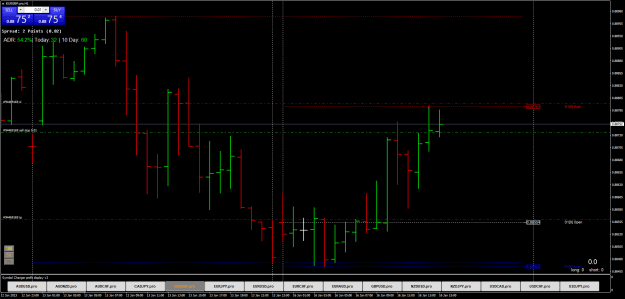
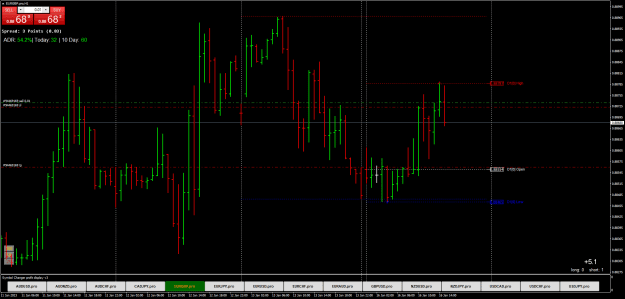
By the way, can you use the candle chart, bar chart is hard to see. And show ít simultaneously with multiple time frame for 01 entry?

Thank you.
 
 
  • Post #11,542
  • Quote
  • Oct 15, 2022 7:24am Oct 15, 2022 7:24am
  •  TooSlow
  • Joined Mar 2012 | Status: Trader | 11,851 Posts
Attached Image (click to enlarge)
Click to Enlarge

Name: TOOSLOW1.png
Size: 29 KB
My Threads: Trading is as simple as 1-2-3, Highest Open / Lowest Open Trade
 
2
  • Post #11,543
  • Quote
  • Oct 20, 2022 5:26pm Oct 20, 2022 5:26pm
  •  TooSlow
  • Joined Mar 2012 | Status: Trader | 11,851 Posts
Attached Image (click to enlarge)
Click to Enlarge

Name: TOOSLOW.png
Size: 31 KB


Having the statistics on what hour usually produces the daily high and daily low gives a slight edge. Cheers!

NOTE: That indicator is from #advancedalientrading
My Threads: Trading is as simple as 1-2-3, Highest Open / Lowest Open Trade
 
1
  • Post #11,544
  • Quote
  • Oct 21, 2022 10:47am Oct 21, 2022 10:47am
  •  TooSlow
  • Joined Mar 2012 | Status: Trader | 11,851 Posts
Attached Image (click to enlarge)
Click to Enlarge

Name: TOOSLOW1.png
Size: 29 KB
My Threads: Trading is as simple as 1-2-3, Highest Open / Lowest Open Trade
 
 
  • Post #11,545
  • Quote
  • Oct 24, 2022 11:37am Oct 24, 2022 11:37am
  •  TooSlow
  • Joined Mar 2012 | Status: Trader | 11,851 Posts
Attached Image (click to enlarge)
Click to Enlarge

Name: TOOSLOW1.png
Size: 30 KB
My Threads: Trading is as simple as 1-2-3, Highest Open / Lowest Open Trade
 
 
  • Post #11,546
  • Quote
  • Edited 3:43pm Oct 26, 2022 2:21pm | Edited 3:43pm
  •  mmb91
  • | Joined Nov 2012 | Status: Member | 92 Posts
I HAVE READ POST #1 AND THE EXAMPLE LINKS BUT I STILL HAVE A QUESTION

in the "Highest Open / Lowest Open Trade" thread, the first post states the following:

"WARNING

When price breaks through yesterday's high or low or makes a new high or low today, that is a breakout!
Trade the reversal with caution."

Is it fair to assume that this applies to this thread, as well? Does that mean most of the trades will present themselves while the current daily bar is inside of yesterday's bar or be in the direction of the breakout?
 
 
  • Post #11,547
  • Quote
  • Oct 26, 2022 7:06pm Oct 26, 2022 7:06pm
  •  ulle73
  • | Joined Nov 2020 | Status: Member | 160 Posts
I HAVE READ POST #1 AND THE EXAMPLE LINKS BUT I STILL HAVE A QUESTION

Sorry, but i really dont understand the text on your chart.

I do understand this comes from TRO, and i do understand the logic with highest/lower open and trade towards the open.

But here we only use h1 as tf? I cant possibly see this system work, momentum beats everyting, every system using momentum trading in the same direction as the bigger timeframe have a much higher possibility of going your way. Why try to pick the bottom/top?

Not questioning your way of trading. but do you have myfxbook or anything where you show results from all those years using this method?
 
 
  • Post #11,548
  • Quote
  • Nov 21, 2022 2:10am Nov 21, 2022 2:10am
  •  ikdenk
  • Joined Nov 2009 | Status: Member | 772 Posts
Quoting TooSlow
Disliked
{image} Having the statistics on what hour usually produces the daily high and daily low gives a slight edge. Cheers! NOTE: That indicator is from #advancedalientrading
Ignored
Your dashboard is so much different than mine, why would that be?

Attached Image (click to enlarge)
Click to Enlarge

Name: USDJPYH1.png
Size: 32 KB
A month should not make that much difference over a 250 day frequency distribution.
 
 
  • Post #11,549
  • Quote
  • Nov 21, 2022 9:08am Nov 21, 2022 9:08am
  •  TooSlow
  • Joined Mar 2012 | Status: Trader | 11,851 Posts
Quoting ikdenk
Disliked
{quote} Your dashboard is so much different than mine, why would that be? {image}A month should not make that much difference over a 250 day frequency distribution.
Ignored
Different brokers. One broker might start their day at a different GMT that another broker and one broker shows current hour as 17:00 while the other broker shows current hour as 15:00.

Different start day? If run your stats a month later, yes they can change.

Cheers!
My Threads: Trading is as simple as 1-2-3, Highest Open / Lowest Open Trade
 
 
  • Post #11,550
  • Quote
  • Nov 23, 2022 5:15am Nov 23, 2022 5:15am
  •  doerpn
  • | Joined Mar 2014 | Status: MEMBER | 742 Posts
Hello @TooSlow and all others...
switching around the threads i came here (again, as already some years ago).
Having looked for a setup that suits to me (seems to be difficult, as this search holds up for years now...).
Thus i study my charts with the $$$Too Slow Version $$$ of the HiLo open Lines indicator....
May i ask a question before reading a lot of content in this thread to master this logic?
Thanks.
There are no W(0) and M(0) lines of high and low....
I don`t think they will occur if price appproaches to the current high/low, right?
Do you put them in manually?
Thanks in advance.
***
If welcomed i like to take one of the next challanges here....but only after reading a lot of stuff here (578 pages = how many days,weeks, months...?)
Attached Image (click to enlarge)
Click to Enlarge

Name: 123W.png
Size: 54 KB
Attachment 4338584
Have a nice day
 
 
  • Post #11,551
  • Quote
  • Nov 24, 2022 6:31am Nov 24, 2022 6:31am
  •  doerpn
  • | Joined Mar 2014 | Status: MEMBER | 742 Posts
I HAVE READ POST #1 AND THE EXAMPLE LINKS BUT I STILL HAVE A QUESTION


Quoting doerpn
Disliked
Hello @TooSlow and all others... switching around the threads i came here (again, as already some years ago). Having looked for a setup that suits to me (seems to be difficult, as this search holds up for years now...). Thus i study my charts with the $$$Too Slow Version $$$ of the HiLo open Lines indicator.... May i ask a question before reading a lot of content in this thread to master this logic? Thanks. There are no W(0) and M(0) lines of high and low.... I don`t think they will occur if price appproaches...
Ignored
Now its correctly....
Have a nice day
 
 
  • Post #11,552
  • Quote
  • Dec 6, 2022 12:42pm Dec 6, 2022 12:42pm
  •  TooSlow
  • Joined Mar 2012 | Status: Trader | 11,851 Posts
Attached Image (click to enlarge)
Click to Enlarge

Name: TOOSLOW1.png
Size: 28 KB
My Threads: Trading is as simple as 1-2-3, Highest Open / Lowest Open Trade
 
 
  • Post #11,553
  • Quote
  • Dec 8, 2022 2:19am Dec 8, 2022 2:19am
  •  ikdenk
  • Joined Nov 2009 | Status: Member | 772 Posts
Dedicated to Lem, for his encouragement, positivity and patient help for his fellow traders here and in the alien sphere.
Attached Image (click to enlarge)
Click to Enlarge

Name: EURJPYH1.png
Size: 21 KB
Attached Image (click to enlarge)
Click to Enlarge

Name: EURJPYM1.png
Size: 28 KB
 
3
  • Post #11,554
  • Quote
  • Dec 13, 2022 1:50am Dec 13, 2022 1:50am
  •  vlad777
  • | Joined Dec 2022 | Status: Junior Member | 1 Post
Can you tell mCan you tНГell me where the price of the sp500 will go?e where the price of the sp500 will go?
Attached Image (click to enlarge)
Click to Enlarge

Name: FreshForex MT4 Terminal.png
Size: 33 KB
 
 
  • Post #11,555
  • Quote
  • Dec 22, 2022 3:30pm Dec 22, 2022 3:30pm
  •  turnip15
  • Joined Sep 2006 | Status: Member | 8,650 Posts
Quoting vlad777
Disliked
Can you tell mCan you tНГell me where the price of the sp500 will go?e where the price of the sp500 will go? {image}
Ignored
You are on the wrong thread chum
every Saint has a past. Every Sinner has a Future
 
 
  • Post #11,556
  • Quote
  • Jan 3, 2023 12:55pm Jan 3, 2023 12:55pm
  •  turnip15
  • Joined Sep 2006 | Status: Member | 8,650 Posts
Quoting TooSlow
Disliked
{image}
Ignored
Great stuff as usual.
every Saint has a past. Every Sinner has a Future
 
 
  • Post #11,557
  • Quote
  • Jan 4, 2023 11:41am Jan 4, 2023 11:41am
  •  TooSlow
  • Joined Mar 2012 | Status: Trader | 11,851 Posts
Attached Image (click to enlarge)
Click to Enlarge

Name: TOOSLOW1.png
Size: 30 KB
My Threads: Trading is as simple as 1-2-3, Highest Open / Lowest Open Trade
 
1
  • Post #11,558
  • Quote
  • Jan 16, 2023 8:17am Jan 16, 2023 8:17am
  •  Dubit10
  • | Joined Apr 2022 | Status: Member | 33 Posts
Waiting
Attached Image (click to enlarge)
Click to Enlarge

Name: EURGBP.proH1.png
Size: 24 KB
 
 
  • Post #11,559
  • Quote
  • Jan 16, 2023 8:34am Jan 16, 2023 8:34am
  •  Dubit10
  • | Joined Apr 2022 | Status: Member | 33 Posts
BE+1

Edit: Stopped out +1
Attached Image (click to enlarge)
Click to Enlarge

Name: EURGBP.proH1.png
Size: 27 KB
 
 
  • Post #11,560
  • Quote
  • Jan 16, 2023 10:50am Jan 16, 2023 10:50am
  •  Sovy
  • | New Member | Status: Junior Member | 1 Post
Quoting TooSlow
Disliked
{image} Highest highs have red caps. In summary, a bar makes a high and closes. Next bar fails to make a higher high and reverses. Sell when price drops below the open price of the current bar. Lowest lows have blue socks. In summary, a bar makes a low and closes. Next bar fails to make a lower low and reverses. Buy when price rises above the open price of the current bar. These are the #2 candles of the 1-2-3 pattern. Use your own discretion in deciding when to trade.
Ignored


I HAVE READ POST #1 AND THE EXAMPLE LINKS BUT I STILL HAVE A QUESTION


Hi, joined forexfactory because of your post. First, thank you. Your idea helped improve my entry 100%.
Secondly. I don't know if it has been mentioned before but, have you tried trendline on the lows or highs of the succeeding prices? Like I tried and I'm able to link buys x sells. Of course right now isn't so good since liquidity is losing since us has a bank day and London is about to close. But been having a lot of 5 plus pip trades and ending in breakeven. Maybe tomorrow will be better.

Again thank you.
 
 
  • Trading Systems
  • /
  • Trading is as simple as 1-2-3
  • Reply to Thread
    • 1 574575576577Page 578 579
    • 1 Page 578 579
0 traders viewing now
  • More
Top of Page
  • Facebook
  • Twitter
About FF
  • Mission
  • Products
  • User Guide
  • Media Kit
  • Blog
  • Contact
FF Products
  • Forums
  • Trades
  • Calendar
  • News
  • Market
  • Brokers
  • Trade Explorer
FF Website
  • Homepage
  • Search
  • Members
  • Report a Bug
Follow FF
  • Facebook
  • Twitter

FF Sister Sites:

  • Metals Mine
  • Energy EXCH
  • Crypto Craft

Forex Factory® is a brand of Fair Economy, Inc.

Terms of Service / ©2023