Latest Version: 1.38
------------------------
Frequently Asked Questions click here
------------------------
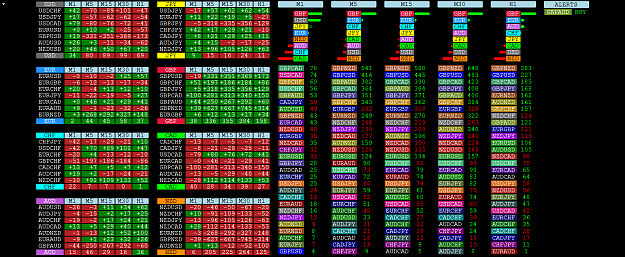
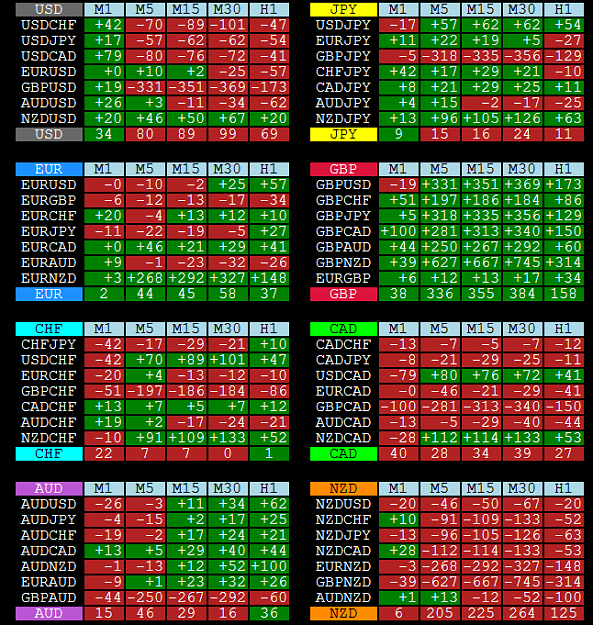
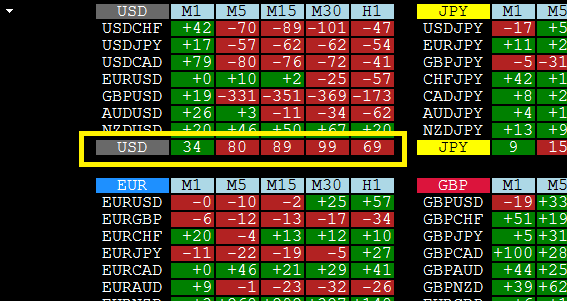
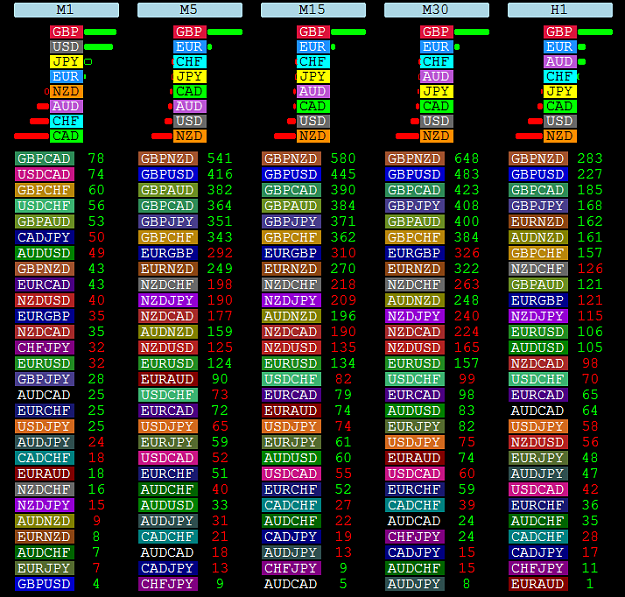
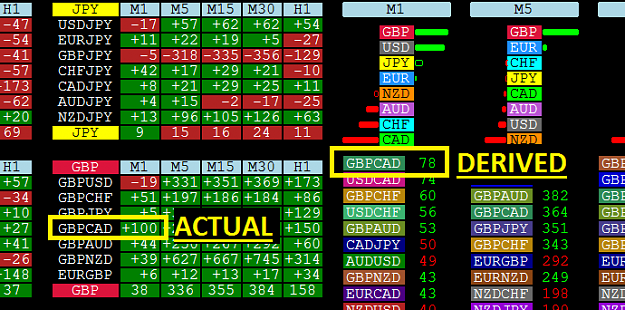
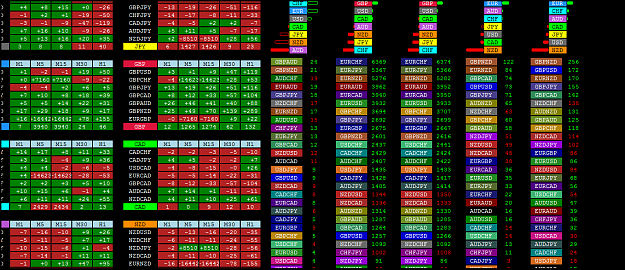
What is MADdash? A multi timeframe dashboard looking at price's distance from a moving average.
Where do I put the file?In the EXPERTS folder. It is a large dashboard designed to take over a chart.
Latest version is an INDICATOR
What is the background to MADdash? Back in April I started the project with 919gilead. This was the parent project to csDash but because MADdash has been stable under testing it has not required many modifications. Consequently, its development is now behind csDash which has benefited from unexpected levels of interest.
Who has tested MADdash? So far, only 919gilead. Hopefully he will chime in with some discussion and comments about its trading application. I haven't traded it personally.
What is likely to happen next? In the short term, bug fixes only; I'm rather swamped with other projects!
Ultimately, I'd like to implement some of the improvements I made in the development of csDash. I'd also like to substitute the CSM logic in place of the MA distance logic (thus giving a MTF CSM).
------------------------
Frequently Asked Questions click here
------------------------
What is MADdash? A multi timeframe dashboard looking at price's distance from a moving average.
Where do I put the file?
Latest version is an INDICATOR
What is the background to MADdash? Back in April I started the project with 919gilead. This was the parent project to csDash but because MADdash has been stable under testing it has not required many modifications. Consequently, its development is now behind csDash which has benefited from unexpected levels of interest.
Who has tested MADdash? So far, only 919gilead. Hopefully he will chime in with some discussion and comments about its trading application. I haven't traded it personally.
What is likely to happen next? In the short term, bug fixes only; I'm rather swamped with other projects!
Ultimately, I'd like to implement some of the improvements I made in the development of csDash. I'd also like to substitute the CSM logic in place of the MA distance logic (thus giving a MTF CSM).
Attached Image (click to enlarge)