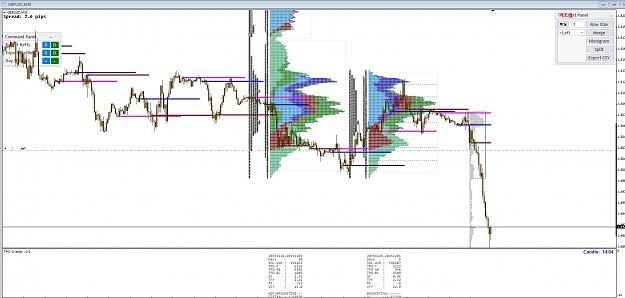
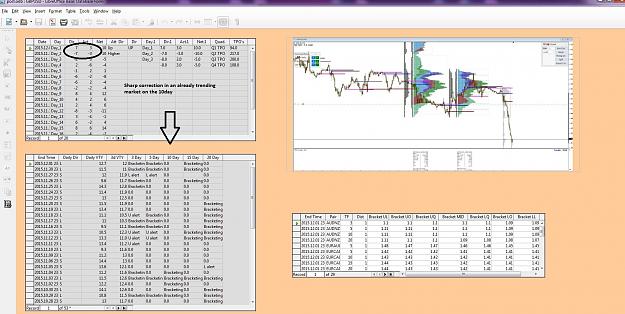
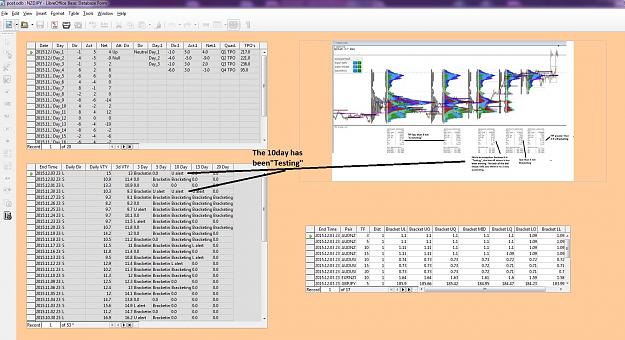
DislikedHi C Just to add... Best to look at TFF with volume in addition to VA range. Interesting though Jone's VGII left out Volume info. VGII only provide 2 days of descriptor if you like to call it, as oppose to 3 day flow which is mainly a tool in the Day Trading Engine (DTE) rather then VG. Ultimately you have to decide which approach suits you best. Flow or no flow. One still have to ascertain the placement of overlay in relationship to the longer time frame. e.g are we still in a confirm up trend, are we in a correction or has the correction turn...Ignored
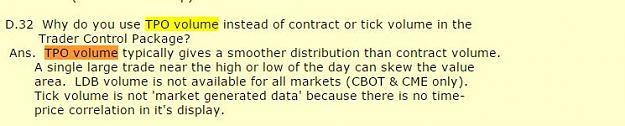
"Tick volume" is not "market generated data" therefore a "volume profile" has never been a permitted practice in MP or AMVT. A volume profile has nothing to do with market profile or AMVT. (that statement wasn't for you, Evak
I believe the Glossary defines that when Jones refers to the term "Volume", he means "TPO Volume".
http://www.cisco-futures.com/glossary.html
The VGII does refer to "total tpos", which imo refers to "tpo volume"
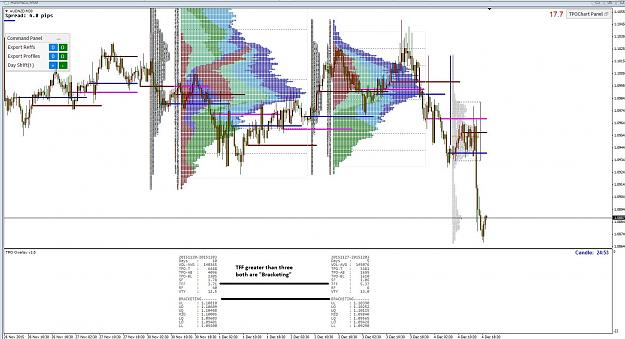
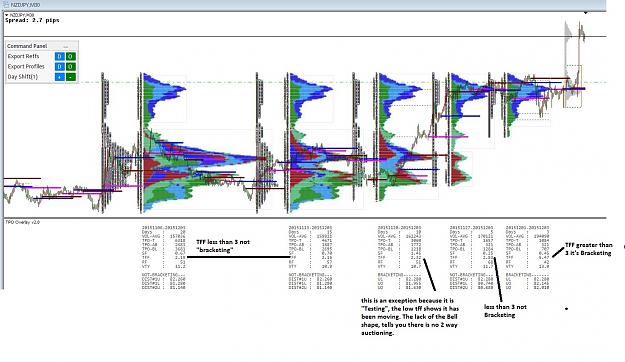
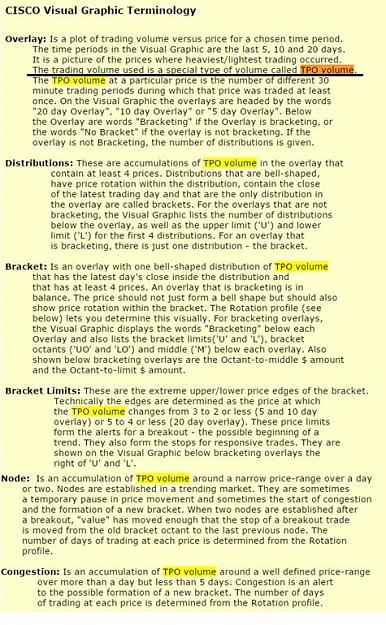
Overlay: Is a plot of trading volume versus price for a chosen time period.
The time periods in the Visual Graphic are the last 5, 10 and 20 days.
It is a picture of the prices where heaviest/lightest trading occurred.
The trading volume used is a special type of volume called TPO volume.
The TPO volume at a particular price is the number of different 30
minute trading periods during which that price was traded at least
once.............
Attached Image(s) (click to enlarge)
Markets are not efficient, rather they are effective - Jones