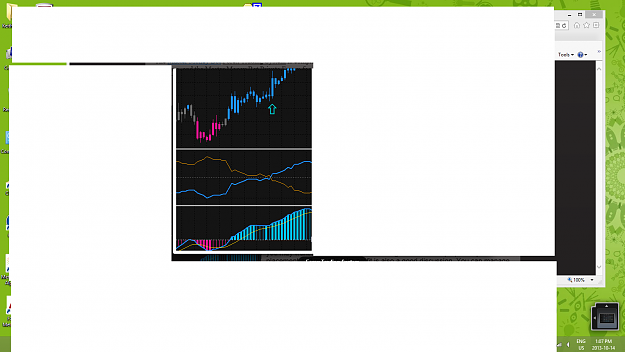
The image below has three indicators.
the changing bars colors likely is an RSI bar indicator, the bottom indicator looks like a MACD
What about the middle indicator the lines crossing, does anyone know what that indicator is?
the changing bars colors likely is an RSI bar indicator, the bottom indicator looks like a MACD
What about the middle indicator the lines crossing, does anyone know what that indicator is?
Attached Image (click to enlarge)