Disliked{quote} Greetings Bluesky - how have you been? I am very glad to be back on FFIgnored
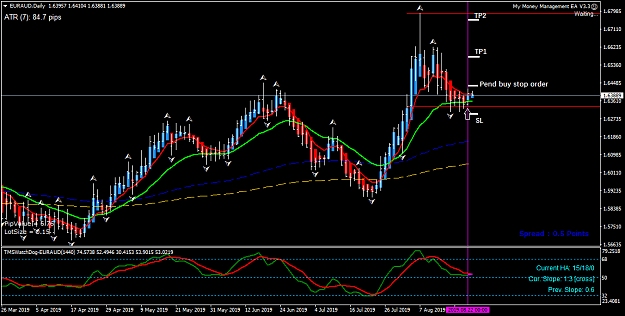
I have a question about MTFA.
Attached Image (click to enlarge)

What scenario can we take a trade when the day chart was against the week chart?
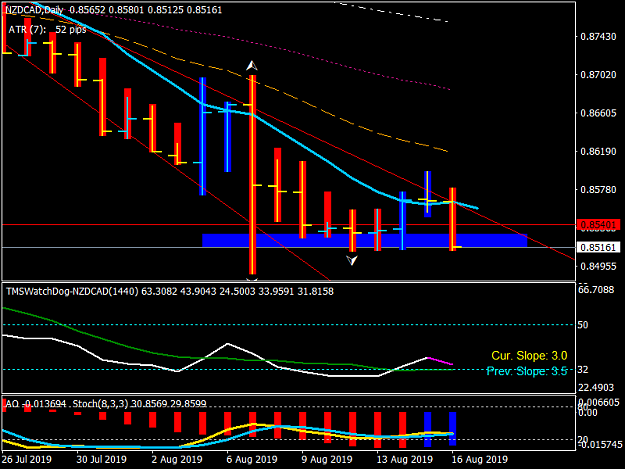
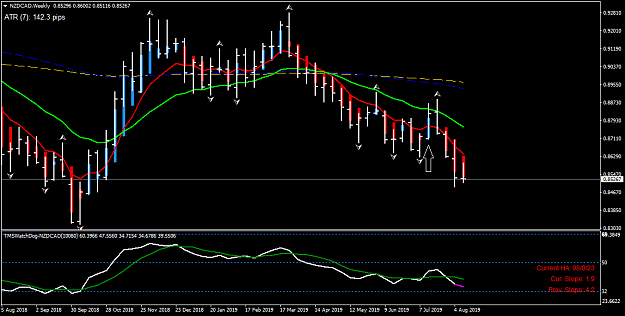
for example the NZDCAD
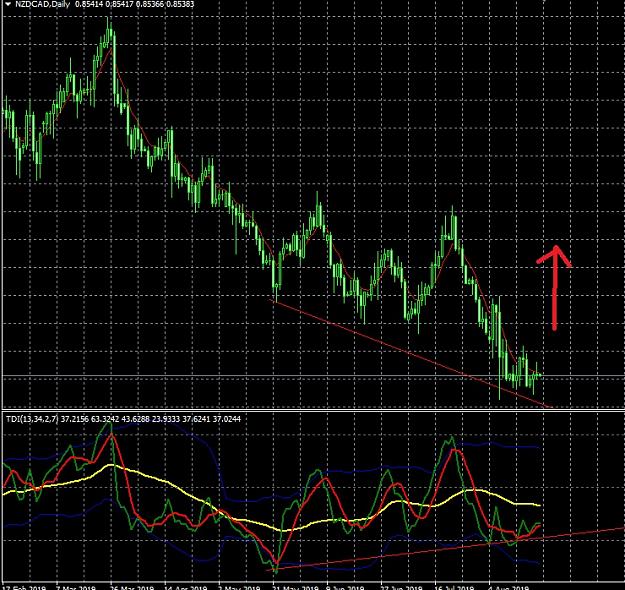
Weekly chart
It made a big bull candle, seems the trend would change to up.
Attached Image (click to enlarge)
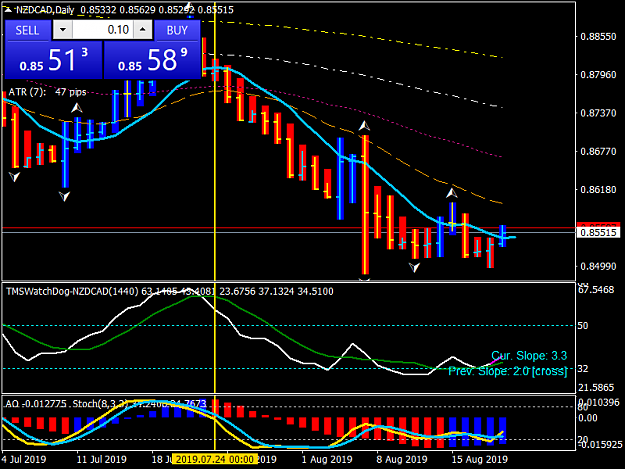
Daily chart
Attached Image (click to enlarge)
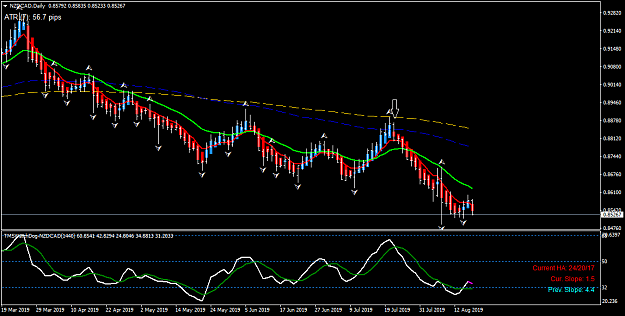
Would you take the trade on daily chart which was against the pre weekly candle?
thanks
Keep DISCIPLINE, control RISKS, and don't destroy your DREAM easily.