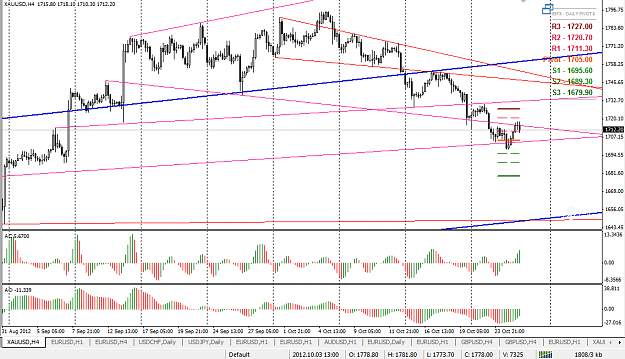
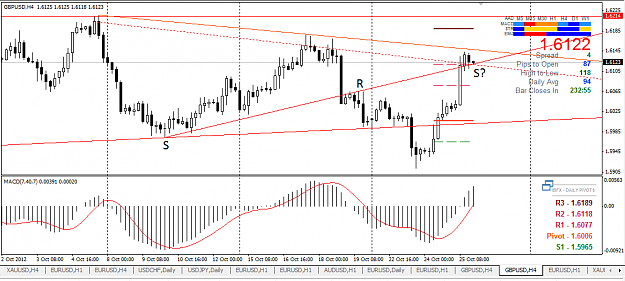
and for cable this could be the scenario
dotted down line in the chart is on the closing 4hr prices and prices broke that and now closed above that i dont know if its real of fake only time will tell and supp/res/supp scenario is also there in the up demand line
click on the chart for larger view
dotted down line in the chart is on the closing 4hr prices and prices broke that and now closed above that i dont know if its real of fake only time will tell and supp/res/supp scenario is also there in the up demand line
click on the chart for larger view
Attached Image (click to enlarge)
Learning Requires Failure