• Home
  • Forums
  • Trades
  • News
  • Calendar
  • Market
  • Brokers
  • Login
  • Join
  • User/Email: Password:
  • 1:29pm
Menu
  • Forums
  • Trades
  • News
  • Calendar
  • Market
  • Brokers
  • Login
  • Join
  • 1:29pm
Sister Sites
  • Metals Mine
  • Energy EXCH
  • Crypto Craft

Options

Bookmark Thread

First Page First Unread Last Page Last Post

Print Thread

Similar Threads

MTF Indicators for the 'Trading Made Simple' system 241 replies

Monitor for 'Trading Made Simple' system 555 replies

Trading Made Simple the right way, and other trading lessons 323 replies

Indicators for the 'Trading Made Simple' system 342 replies

Trading Made Simple system follower - Thanks to eelfranz 9 replies

  • Trading Systems
  • /
  • Reply to Thread
  • Subscribe
  • 60,674
Attachments: Trading Made Simple
Exit Attachments
Tags: Trading Made Simple
Cancel

Trading Made Simple

  • Last Post
  •  
  • 1 673674Page 675676677 6888
  • 1 Page 675 6888
  •  
  • Post #13,481
  • Quote
  • Nov 11, 2011 9:01am Nov 11, 2011 9:01am
  •  dcginc
  • | Commercial Member | Joined Jul 2011 | 236 Posts
“Trading is 10% psychology and 90% mechanics – until you have live money in the market – at which point it becomes 10% mechanics and 90% psychology.” Todd Brown.

"Trading is 90% psychology and 10% system. The way 90% of traders on this thread talk and execute the Big E strategy makes any instruction on managing your emotional state (add: position sizing, profit expectancy and trade management) clearly more important than discussing the angle of the TDI or the value of the Stochastic. The problem is, you have to blow up a few fully loaded accounts to understand this. There has been 10 times the technical discussion than is necessary to implement this system, but people either need their hand held, want to show off or are just too lazy to read the first 50 pages of the thread. The way people on forums (due to the anonymity it affords) can be so rude and condescending guarantees that most good traders (excluding the exceptionally kind hearted, bored or generous ones) don't even bother logging in. It is OK to be new and incompetent or experienced and still incompetent, but you should think twice before posting to prove it. This is not a game - it is just too expensive in time and money to think that way. Sharpen up and start really thinking about the whole process like a business or you will just lose - 100% guaranteed. One thing that I have been told on the subject of psychology that might help someone here is that "emotional traders pay disciplined traders". Repeat it out aloud next time you are in a trade! all the best - H." (Hawaii5000)

One of the best I have ever seen.

dcginc
 
1
  • Post #13,482
  • Quote
  • Nov 11, 2011 11:10am Nov 11, 2011 11:10am
  •  nunrgguy
  • Joined May 2009 | Status: Member | 757 Posts
Hi peeps, I'm only up to page 78 of the thread and am a slow reader.
My question is basically about staying out of chop and getting in after chop. All todays charts across the markets have pretty much looked like this:

http://i1236.photobucket.com/albums/...lefridayh1.gif

Yeah, we've had moves all week and today is Friday.

Anyway - red line on TDI flat - stay out. OK. Took 2 trades on Aussie and Kiwi as they looked slightly better - TDI tweaked so went into break even mode and got out for a few pips in the red on each one.

Later on we get breakouts pretty much across the board, straight to the max with no pull back on the hourly. The only way I could perhaps see of getting in on that move without taking all of the false ones prior is to also use the angle of H4 at point of entry. Going purely on the hourly the first proper strong up candle was number 3 so no entry.

Am I close?
 
 
  • Post #13,483
  • Quote
  • Nov 11, 2011 12:22pm Nov 11, 2011 12:22pm
  •  darkopo
  • | Joined Oct 2011 | Status: Member | 5 Posts
What are the best times to enter a trade on 4H if we have confirmation from the TDI ?
On my broker IBFX candle appears on the London opening.
If I have a strong signal on TDI is good time for entry or is it better to switch to 1H ?
 
 
  • Post #13,484
  • Quote
  • Nov 11, 2011 1:46pm Nov 11, 2011 1:46pm
  •  zortan
  • | Joined Aug 2010 | Status: Member | 170 Posts
Quoting nunrgguy
Disliked
Hi peeps, I'm only up to page 78 of the thread and am a slow reader.
My question is basically about staying out of chop and getting in after chop. All todays charts across the markets have pretty much looked like this:


Yeah, we've had moves all week and today is Friday.

Anyway - red line on TDI flat - stay out. OK. Took 2 trades on Aussie and Kiwi as they looked slightly better - TDI tweaked so went into break even mode and got out for a few pips in the red on each one.

Later on we get breakouts pretty much across the board, straight to the...
Ignored
When the red and green are winding around each other it's best to keep out, when there is finally a break out wait for a nice steep angle and for it to move from the base line, don't worry about getting in on the TDI cross, in this instance taking 2nd - 4th bar is fine as the move is confirmed. If you are more cautious or inexperienced just wait for another set up. Go back to previous days and see where this has happened, it happens often, this'll will give you more confidence on your entries.

As others have said when using the TMS watching other timeframes isn't useful, because you'll always find a reason not to take a trade, watch just one TF and stick to it, that to me is the nature of this method.
 
 
  • Post #13,485
  • Quote
  • Nov 11, 2011 2:09pm Nov 11, 2011 2:09pm
  •  rivtrader
  • | Joined Oct 2011 | Status: Member | 224 Posts
Quoting Britpip7
Disliked
Anyone have any thoughts / opinions on this topic?

Consider the possibility that you have been trading TMS successfully for several months and that you have been achieving a consistent monthly trading accuracy of over 70%.

Your pips win to loss ratio is 3 to 1

At what point would you consider risking a higher amount (% of your account balance) in your trading?

a) Never

b) May consider the occassional trade to test the theory for a really good entry position

c) Full steam ahead - rewrite the MM plan and go for it
Ignored

Hi Brit,

I would have to say C using this logic.

1- I would have confirmed the system works.

2- I would calculate the largest drawdown. Let's say its $100.

3- Multiply the largest drawdown by 2 for added account protection.

4- Add the required margin. Say $300 for a US broker or $30 for any other broker with 500:1 margin on a mini account $1 per pip on EURUSD.

5- Let's go with a Non US broker.

6- The total would be $230.00 so I round that to $300 ( my personal rounding criteria to add a little more margin protection).

7- I would then take $300 that I could afford to lose without damaging my lifestyle and commence trading 1 lot.

8- I would use compounding method, trading 1 lot for every $300. It's aggressive but it's money I can afford to lose anyway so no harm done.

9- Let it ride.
 
 
  • Post #13,486
  • Quote
  • Nov 11, 2011 2:54pm Nov 11, 2011 2:54pm
  •  Fullpip
  • | Joined Sep 2011 | Status: Member | 32 Posts
[quote=Xaphod;5123646]Come on. Ok, I'm game. Lets test this magical TDI Red-Green that can foresee the future.
Reference chart:
http://www.forexfactory.com/attachme...1&d=1320955241
from this post:
http://www.forexfactory.com/showthre...62#post5122762

Nice analysis Xaphod.
Your reply post actually helps illustrates(vs. time consuming discussions) to me very well a few points about the technical basis of TMS.
PA-TDI angle-2nd Candle entry etc.
Sharp candle reversal on close of H1, paints the sharp TDI Cross (G>R), giving the H1 trader the initial setup hint, for a long. TDI angle is a reflection of this abruptness (price change/time). Followthough likely, but not always. Your post helps illustrate the "TDI angle" evolution succintly.

Immediate entry on the open of the second candle allows an early entry on this possible trend change and permit capture of more pips. TMS recommendation to enter on the 2nd candle, if possible.

PA only proponents, depending on their proclaimed skills, can pick as early as the first reversal tick. I would like an indicator for that.http://www.forexfactory.com/images/icons/icon12.gif
Your work on Indi's also appreciated.

JMflukiii: If this variation of TMS works, few charts like xaphod post would help illustrate your method/ tweak. On the face of it, it does not appear logical and may throw some TMS students off kilter. Off thread discussion?
I am still learning to apply TMS profitably, despite it's simplicity.

Fullpiphttp://www.forexfactory.com/images/icons/icon7.gif
 
 
  • Post #13,487
  • Quote
  • Nov 11, 2011 2:55pm Nov 11, 2011 2:55pm
  •  nunrgguy
  • Joined May 2009 | Status: Member | 757 Posts
Thanks Zortan
 
 
  • Post #13,488
  • Quote
  • Nov 12, 2011 4:55pm Nov 12, 2011 4:55pm
  •  MichaelSimon
  • | Joined Sep 2011 | Status: Member | 66 Posts
Quoting Britpip7
Disliked
Anyone have any thoughts / opinions on this topic?

Consider the possibility that you have been trading TMS successfully for several months and that you have been achieving a consistent monthly trading accuracy of over 70%.

Your pips win to loss ratio is 3 to 1

At what point would you consider risking a higher amount (% of your account balance) in your trading?

a) Never

b) May consider the occassional trade to test the theory for a really good entry position

c) Full steam ahead - rewrite the MM plan and go for it
Ignored
It may be easy for me to say and may not be worth much as I have yet to be tested in this situation.
I hope you are asking because this is the dilema youre facing atm .But for what it is worth,
I think, why would you want to or need to?
If you have been this successful and been compounding your equity you must be at a stage where 2% of you balance is more than enough money already.
If anything, I think if I had consistent success at this level, the % risked would be less per trade.
2% of $5,000 is $100
1.5% of 10,000 is $150
1% of 20,000 is $200... etc
Compound Equity to where your monthly profit suits your needs at the same - or even better, lower risk.
Because isn't lowering the risk of ruin the most important in the long run? Wow how relaxing would life be if you could make enough money risking only 0.5% of your trading account on open positions at any time..
 
 
  • Post #13,489
  • Quote
  • Nov 12, 2011 6:59pm Nov 12, 2011 6:59pm
  •  Xaphod
  • Joined Mar 2010 | Status: Member | 1,380 Posts
Quoting Fullpip
Disliked
If this variation of TMS works, few charts like xaphod post would help illustrate your method/ tweak. On the face of it, it does not appear logical and may throw some TMS students off kilter. Off thread discussion?
Ignored
One can just ignore the proposed variation as the examples seem to be faked:


  1. The trades are drawn on a refreshed chart, he claims his indicator does not repaint.
  2. The last trade he claims he took did not not have an entry signal when he claims he entered. In fact, his TDI did not give an entry signal until after the candle closed and at that point he was closing the trade, not opening it.
  3. The prior examples are all in a strong down trend. It is easy to pick off entries in a strong down trend after the fact. Quite brainless as he puts it.


  • Post #13,490
  • Quote
  • Nov 13, 2011 5:10am Nov 13, 2011 5:10am
  •  Luchetto93
  • | Joined Nov 2011 | Status: Member | 53 Posts
Hey everybody,
somebody tried this method on binary options?
 
 
  • Post #13,491
  • Quote
  • Nov 13, 2011 5:13am Nov 13, 2011 5:13am
  •  smatthew
  • | Joined Sep 2011 | Status: Would like to profit consistently | 233 Posts
Quoting Britpip7
Disliked
From all of the backtesting looking at SL levels, I was using ATR (7). For a TDI cross on the H4 charts I was using several approaches for SL - Dean Malone price range 5SMA H/L, ATR(7) and using the previous swing H/L.

Wherever there was a drawdown I was usually seeing a worst case value in the region of 1.5XATR - so for an ATR(7) of 80, max DD was in the 120 to 140pip range.

I had very few back test trades that hit a SL of 2XATR(7) - around 2%.

With that said, using the 2XATR(7) approach, you need to be able to size your lots accordingly...
Ignored
Thanks for your valuable analysis. Piprac also advised to use the ATR indi to determine stoploss. Any reason why ATR(7) would be preferable over ATR(14), which is Piprac's setting?
Piprac also mentioned to use fractals for setting SL. IMO in most cases this would lead to a smaller SL as opposed to a SL based on ATR.
What are your opinions on fractals vs. ATR?
Financial independence is what I live for
 
 
  • Post #13,492
  • Quote
  • Nov 13, 2011 11:24am Nov 13, 2011 11:24am
  •  Britpip7
  • Joined Apr 2011 | Status: "Never Give Up - Never Surrender" | 1,608 Posts
Quoting Xaphod
Disliked
One can just ignore the proposed variation as the examples seem to be faked:
[list][*]The trades are drawn on a refreshed chart, he claims his indicator does not repaint.[*]The last trade he claims he took did not not have an entry signal when he claims he entered. In fact, his TDI did not give an entry signal until after the candle closed and at that point he was closing the trade, not opening it.[*]The prior examples are all in a strong down trend. It is easy to pick off entries in a strong down trend after the fact. Quite brainless as he...
Ignored
Not sure that this looks like it is going to provide any benefits over the accepted TMS approach - Unless you want to spend a bunch of time backtesting and then forward testing this in parallel with the current TDI Red/Green, Watchdog or similar. Currently my vote is for the thread members is to stick with TMS as written , tested and proven.

There is little evidence that any indicator can provide an earlier entry than TMS and as pointed out by several thread members, all indicators are lagging and none are predictive - even pattern analysis and forecasting is all based on historical representation and therefore lagging by definition, so Elliot Waves / Fibs, etc. although good for analysing, really do nothing IMO to get you into trades any earlier as there is no guarentees on the number of legs / break throughs on Fibs, etc. (Actually, although folks swear by these, the really do confuse the heck out of me!).

Add ons to TMS for S/R, Fractals, 1/2/3 patterns, MA Cross Overs, all add more clutter to the charts, and for newbies will confuse the heck out of the decsion making proceses.

Keep it Simple folks - find your trading style, refine your trading and mm plans, go live with micro accounts and perfect you entries, SL and TPs and then increase you stake money according to your mm plan.
"To live with Passion, it takes Courage and Grace to survive"
 
 
  • Post #13,493
  • Quote
  • Nov 13, 2011 11:52am Nov 13, 2011 11:52am
  •  AlexC
  • Joined Jan 2010 | Status: Primary Technical Trader | 7,623 Posts
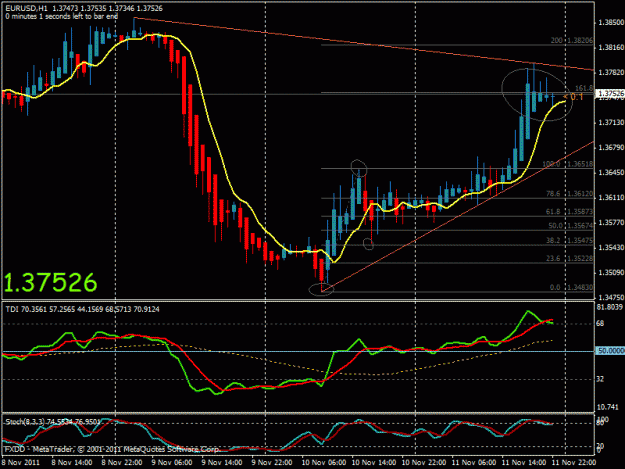
If you have the time, throw in some fibs or trendlines. It can add perspective.
Attached Image (click to enlarge)
Click to Enlarge

Name: e u 111211.gif
Size: 25 KB
 
 
  • Post #13,494
  • Quote
  • Nov 13, 2011 3:59pm Nov 13, 2011 3:59pm
  •  Britpip7
  • Joined Apr 2011 | Status: "Never Give Up - Never Surrender" | 1,608 Posts
Quoting smatthew
Disliked
Thanks for your valuable analysis. Piprac also advised to use the ATR indi to determine stoploss. Any reason why ATR(7) would be preferable over ATR(14), which is Piprac's setting?
Piprac also mentioned to use fractals for setting SL. IMO in most cases this would lead to a smaller SL as opposed to a SL based on ATR.
What are your opinions on fractals vs. ATR?
Ignored
With regards to ATR(7) vs ATR(14), I have not compared the two - just running a quick compare, not a huge difference between the two settings and the values that they deliver, so it would appear either would work satisfactorilly - I selected ATR(7) after reading dcginc's posts on the topic and have found on backtesting and froward testing / live that it has suited my trading approach.

With regards to fractals, I have mostly used these as entry points for trend continuations per my earlier postings on the topic.

I do use them for looking at recent levels of consolidation / support / resistance as well as using them for Divergence / Convergence with either TDI or Stochastics.

As far as using Fractals for setting SL, depends what the range has been doing - as well as previous swing H/L - usually the ATR(7) is close to swing H/L unless you have had an unusual movement such as SNB / BOJ intervetnion, etc. Also some of the exotics have very high ATR values in the higher time frames and may not sit well with your MM plans.

Hope that helps.
"To live with Passion, it takes Courage and Grace to survive"
 
 
  • Post #13,495
  • Quote
  • Nov 13, 2011 4:38pm Nov 13, 2011 4:38pm
  •  smatthew
  • | Joined Sep 2011 | Status: Would like to profit consistently | 233 Posts
Quoting Britpip7
Disliked
With regards to ATR(7) vs ATR(14), I have not compared the two - just running a quick compare, not a huge difference between the two settings and the values that they deliver, so it would appear either would work satisfactorilly - I selected ATR(7) after reading dcginc's posts on the topic and have found on backtesting and froward testing / live that it has suited my trading approach.

With regards to fractals, I have mostly used these as entry points for trend continuations per my earlier postings on the topic.

I do use them for looking...
Ignored
The ATR values indeed don't differ much comparing 7 and 14.
I only look for trade opportunities on The Three Amigos (H4), no weird ATR values to be expected there.

Fractals can be quite helpful!
Large numbers of fractals close together nicely identify consolidation.
Ofcourse ugly looking small wicky candles are just as good.
Fractals also make it easier to spot bounce trades as well.
Haven't used them for identifying divergence yet. Will give it a try.

As for the SL's, next week I'm going to try out a fixed stop loss of 80 pips (I'm on demo).
I hope that'll keep most trades from getting stopped out.
The ATM in Ninjatrader should take care of BE (at +80).

I've configured my PC to send screenshots every 30 mins. to Picasa which I view on my iPhone. This way I can still get some trades in and monitor them during work hours
If the markets are going to range, I can still remotely close trades that aren't going anywhere.
Financial independence is what I live for
 
 
  • Post #13,496
  • Quote
  • Nov 14, 2011 1:10am Nov 14, 2011 1:10am
  •  amiralifx
  • Joined Aug 2011 | Status: Member | 385 Posts
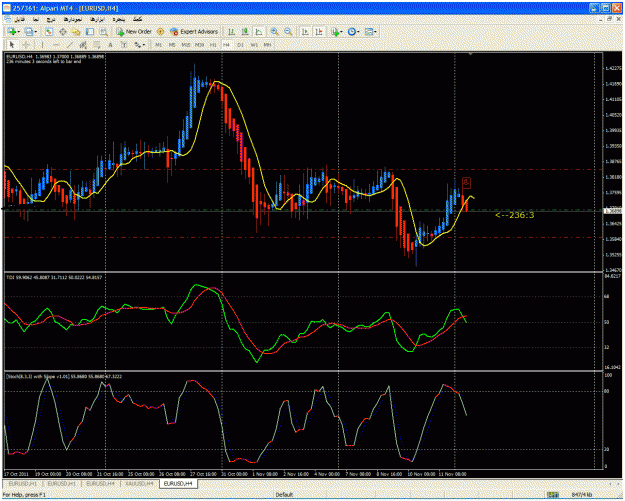
sell eu h1

Attached Image (click to enlarge)
Click to Enlarge

Name: sell eurusdh1.gif
Size: 52 KB
 
 
  • Post #13,497
  • Quote
  • Edited 3:24am Nov 14, 2011 3:08am | Edited 3:24am
  •  amiralifx
  • Joined Aug 2011 | Status: Member | 385 Posts
Quoting amiralifx
Disliked
sell eu h1

Attachment 830619
Ignored
sl= be

closed at 0
 
 
  • Post #13,498
  • Quote
  • Nov 14, 2011 5:11am Nov 14, 2011 5:11am
  •  amiralifx
  • Joined Aug 2011 | Status: Member | 385 Posts
sell eu h4

Attached Image (click to enlarge)
Click to Enlarge

Name: h4.gif
Size: 53 KB
 
 
  • Post #13,499
  • Quote
  • Nov 14, 2011 5:17am Nov 14, 2011 5:17am
  •  aren
  • | Joined May 2011 | Status: Member | 185 Posts
love it.
Attached Image (click to enlarge)
Click to Enlarge

Name: ee.JPG
Size: 91 KB
 
 
  • Post #13,500
  • Quote
  • Nov 14, 2011 6:26am Nov 14, 2011 6:26am
  •  zortan
  • | Joined Aug 2010 | Status: Member | 170 Posts
Quoting amiralifx
Disliked
sl= be

closed at 0
Ignored
How did your SL get hit? Looks like you had plenty of room on your chart.

I wouldn't have taken the 4hr trade personally, the green line is heading into the base line, also price is entering area of S & R.
 
 
  • Trading Systems
  • /
  • Trading Made Simple
  • Reply to Thread
    • 1 673674Page 675676677 6888
    • 1 Page 675 6888
2 traders viewing now, 1 is a member:
mosnfet
  • More
Top of Page
  • Facebook
  • Twitter
About FF
  • Mission
  • Products
  • User Guide
  • Media Kit
  • Blog
  • Contact
FF Products
  • Forums
  • Trades
  • Calendar
  • News
  • Market
  • Brokers
  • Trade Explorer
FF Website
  • Homepage
  • Search
  • Members
  • Report a Bug
Follow FF
  • Facebook
  • Twitter

FF Sister Sites:

  • Metals Mine
  • Energy EXCH
  • Crypto Craft

Forex Factory® is a brand of Fair Economy, Inc.

Terms of Service / ©2023