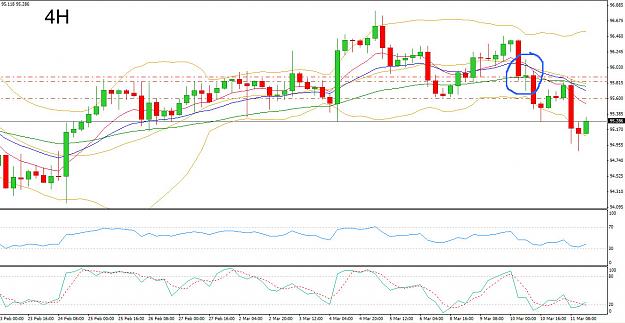
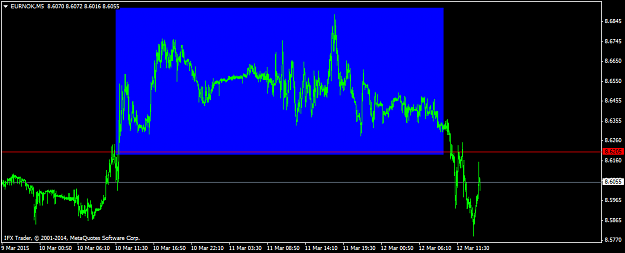
• Home
  • Forums
  • Trades
  • News
  • Calendar
  • Market
  • Brokers
  • Login
  • Join
  • User/Email: Password:
  • 5:20pm
Menu
  • Forums
  • Trades
  • News
  • Calendar
  • Market
  • Brokers
  • Login
  • Join
  • 5:20pm
Sister Sites
  • Metals Mine
  • Energy EXCH
  • Crypto Craft

Options

Bookmark Thread

First Page First Unread Last Page Last Post

Print Thread

Similar Threads

Milking 4 pairs AUD/NZD, EUR/GBP,NZD/CAD & AUD/CAD for a living 38 replies

EUR/USD, AUD/USD, and CAD/USD ready to move up 2 replies

EUR/GBP, EUR/USD, GBP/USD, AUD/USD, CAD, NZD, JPY, and more... 14 replies

USD/JPY - USD/CAD any thoughts? 4 replies

CAD export / USD/CAD price 3 replies

  • Interactive Trading
  • /
  • Reply to Thread
  • Subscribe
  • 5,446
Attachments: USD/CAD
Exit Attachments
Tags: USD/CAD
Cancel

USD/CAD

  • Last Post
  •  
  • 1 356357Page 358359360 855
  • 1 Page 358 855
  •  
  • Post #7,141
  • Quote
  • Mar 11, 2015 2:32pm Mar 11, 2015 2:32pm
  •  JoeyTTU
  • | Joined Mar 2013 | Status: Member | 103 Posts
Quoting digger1
Disliked
{quote} roids lol, some other pairs off the roids going the other way is helping, Sucks having to take a loss, you my friend kept it from turning into a huge loser or adding to a loser , took me thousands and thousands to get that thru my head , well done. Dont know if you read my other post to you but here is an hourly chart with that average on it . NOT A HOLY GRAIL, just a tool , gives you a sense of the days direction. As you can see we had several days where the days mid point in the same area , waiting for nfp, nfp better than expected by...
Ignored
I missed your last post but I just checked it out and added a 6&24 EMA and I see what you're talking about. Seems to be more accurate than the # of candles I was previously using.
To maximize your gains you must minimize your losses
 
 
  • Post #7,142
  • Quote
  • Mar 11, 2015 2:44pm Mar 11, 2015 2:44pm
  •  digger1
  • Joined Jan 2010 | Status: The Voodoo Boodoo Club | 32,959 Posts | Online Now
Quoting JoeyTTU
Disliked
{quote} I missed your last post but I just checked it out and added a 6&24 EMA and I see what you're talking about. Seems to be more accurate than the # of candles I was previously using.
Ignored
Put a 200 on your 4 hour chart, just remember , not a holy grail just a tool, , pretty powerful ones when you learn and watch them for a while. cheers
 
 
  • Post #7,143
  • Quote
  • Mar 11, 2015 3:18pm Mar 11, 2015 3:18pm
  •  digger1
  • Joined Jan 2010 | Status: The Voodoo Boodoo Club | 32,959 Posts | Online Now
Quoting JoeyTTU
Disliked
{quote} I missed your last post but I just checked it out and added a 6&24 EMA and I see what you're talking about. Seems to be more accurate than the # of candles I was previously using.
Ignored
Look at a monthly chart, blue is a 200ema. No one will ever convince me that big money doesent keep an eye on these till pictures like this change. That little green circle on the bottom is where the daily price got above the daily 200 and stayed there. This place (ffactory ) was littered with traders calling a bottom all the way down , making a big deal of catching a few against the trend while watching countless pips pass them by. Now a top will be called all the way back up lol, never changes , just practice to trade what you see and use good tools. The monthly blasted thru the 200 recently on the way back up, doesent look like any big money at all sold into that, good reason to take note. We get above that F flag on the monthly could be a while before it even tests the 200. This is a monthly so granted there will be some good trades against the monthly trend but best to keep note of it, it will pay way better lol. Monthly close above that flag , use the pip count in the flag pole for a projection.
Attached Image (click to enlarge)
Click to Enlarge

Name: Cad monthly.jpg
Size: 287 KB
 
 
  • Post #7,144
  • Quote
  • Mar 11, 2015 3:21pm Mar 11, 2015 3:21pm
  •  digger1
  • Joined Jan 2010 | Status: The Voodoo Boodoo Club | 32,959 Posts | Online Now
And please dont take a trade just because it looks like it has went a certain way long enough and it should be changing direction, lol
 
 
  • Post #7,145
  • Quote
  • Mar 11, 2015 3:55pm Mar 11, 2015 3:55pm
  •  usdoutlaw
  • | Joined Oct 2009 | Status: Member | 199 Posts
Quoting digger1
Disliked
{quote} Look at a monthly chart, blue is a 200ema. No one will ever convince me that big money doesent keep an eye on these till pictures like this change. That little green circle on the bottom is where the daily price got above the daily 200 and stayed there. This place (ffactory ) was littered with traders calling a bottom all the way down , making a big deal of catching a few against the trend while watching countless pips pass them by. Now a top will be called all the way back up lol, never changes , just practice to trade what you see and...
Ignored
blah blah blah

the only thing you should take away from that chart is the break out from the 2014 jan - jun down trend. Right there is the perfect time to gamble on a change in long term trend aka 200 EMA. Once usdcad pierced the double top created in March every trader should have been piling in on a pull back to test the 200 EMA. If you were wrong you would only lose at most 5 cents depending on your stop.

Also take notice that once the USDCAD crossed the 200 EMA convincingly it went for a 40 cent ride. I am convinced that the USDCAD will pull back but not test the 200 EMA since things are different this time around and we are going to 5000 quick because everyone is chasing performance these days. I mean you can't keep on buying apple amazon and netflix forever can you?

Want a better trade ? look at the CADJPY 4H. The candle pattern is red leg, hammer, green ladder, red leg, hammer ... I assume its another green ladder to possible 95.50 - 95.60 and another red leg and hammer to target possible 94.50 - 94.60. Thats probably as far as I would take it since its 4H and you are betting on a 3rd red leg down. (I shorted near the top of the second red leg down and I am targeting 94.60 on the 3rd red leg for some baby pips / my stop was 96.80 which is above the 4H upper bollinger but I moved it down to break even with my entry)
hope for the best and expect the worst.
 
 
  • Post #7,146
  • Quote
  • Mar 11, 2015 4:04pm Mar 11, 2015 4:04pm
  •  digger1
  • Joined Jan 2010 | Status: The Voodoo Boodoo Club | 32,959 Posts | Online Now
Quoting usdoutlaw
Disliked
{quote} blah blah blah the only thing you should take away from that chart is the break out from the 2014 jan - jun down trend. Right there is the perfect time to gamble on a change in long term trend aka 200 EMA. Once usdcad pierced the double top created in March every trader should have been piling in on a pull back to test the 200 EMA. If you were wrong you would only lose at most 5 cents depending on your stop. Also take notice that once the USDCAD crossed the 200 EMA convincingly it went for a 40 cent ride. I am convinced that the USDCAD will...
Ignored
Lol, Im not knocking you man , your making money that's awesome, I wish everybody did, everything is just a tool, lot of different things to use , this works for me, may help someone else is all , cheers
 
 
  • Post #7,147
  • Quote
  • Mar 11, 2015 5:00pm Mar 11, 2015 5:00pm
  •  digger1
  • Joined Jan 2010 | Status: The Voodoo Boodoo Club | 32,959 Posts | Online Now
Not a pair I trade so cant say for sure , but trading like all the other pairs I trade end result pretty much the same . You know candle sticks, I dont, , 4 hour 200 ema place of interest lol, hourly -the entry points I would be looking to try , two different tools same result,, cheers man.
Attached Image (click to enlarge)
Click to Enlarge

Name: cad jpy 4 hour.jpg
Size: 391 KB
Attached Image (click to enlarge)
Click to Enlarge

Name: cad yen hourly.jpg
Size: 466 KB
 
 
  • Post #7,148
  • Quote
  • Mar 11, 2015 6:30pm Mar 11, 2015 6:30pm
  •  julesocean
  • | Joined Dec 2014 | Status: Member | 92 Posts
Quoting digger1
Disliked
And please dont take a trade just because it looks like it has went a certain way long enough and it should be changing direction, lol
Ignored
Yeah lol, I learned alot of lessons this way.
 
 
  • Post #7,149
  • Quote
  • Mar 11, 2015 6:32pm Mar 11, 2015 6:32pm
  •  digger1
  • Joined Jan 2010 | Status: The Voodoo Boodoo Club | 32,959 Posts | Online Now
Quoting julesocean
Disliked
{quote} Yeah lol, I learned alot of lessons this way.
Ignored
Your not alone , gets costly after while.
 
 
  • Post #7,150
  • Quote
  • Mar 11, 2015 6:59pm Mar 11, 2015 6:59pm
  •  usdoutlaw
  • | Joined Oct 2009 | Status: Member | 199 Posts
Quoting digger1
Disliked
{quote} Lol, Im not knocking you man , your making money that's awesome, I wish everybody did, everything is just a tool, lot of different things to use , this works for me, may help someone else is all , cheers
Ignored
I know its a tool. If it works it works. But if the analysis gets too complicated then you are getting into modeling and forecasting, and everyone know how those worked in 2008-2009.

It's easier to just to look at it as risk and fear.
hope for the best and expect the worst.
 
 
  • Post #7,151
  • Quote
  • Mar 11, 2015 7:06pm Mar 11, 2015 7:06pm
  •  usdoutlaw
  • | Joined Oct 2009 | Status: Member | 199 Posts
Quoting digger1
Disliked
Not a pair I trade so cant say for sure , but trading like all the other pairs I trade end result pretty much the same . You know candle sticks, I dont, , 4 hour 200 ema place of interest lol, hourly -the entry points I would be looking to try , two different tools same result,, cheers man. {image} {image}
Ignored
candle sticks are a measure of fear and risk through price action. It's the best way to make baby pips. Moving average and RSIs and Stochs and MACDs are better for figuring out trends. Candlesticks were originally for daily analysis but now that information is so abundant I find that you really cant trust them against a trending trade.
hope for the best and expect the worst.
 
 
  • Post #7,152
  • Quote
  • Mar 11, 2015 7:58pm Mar 11, 2015 7:58pm
  •  usdoutlaw
  • | Joined Oct 2009 | Status: Member | 199 Posts
Maybe you think I am crazy but since digger doesn't know how to bet on candle sticks, I will demonstrate how to get baby pips through candle patterns.

First there might not be a pattern at all, but there are always classic patterns lingering around so get comfortable with comparing 1H and 4H candles

Attached Image (click to enlarge)
Click to Enlarge

Name: cadjpy 4H.jpg
Size: 212 KB

This 4H chart is what I looked at first. The blue circle is a super wicked/shadowed doji. This could signify a change in direction or a continuation in direction. It is really 50/50 like it suggests; opens and closes virtually at the same price with bulls and bears taking control half of the time. The next candle is a strong 4H bear. So, basically I missed it because I didn't want to make a bet on a 50/50 direction. The next 4H is a really strong hammer which means the bears were in control at first but then the bulls took over at the end of the 4H. Now begins the step pattern or what I refer as a ladder. The ladder is a no man's land drift with few trades and basically controlled by dealers to make up for all the CADJPY they supposedly bought on the bearish leg down (you will notice this type of drift a lot during Asian hours). Note one could have bought after the hammer formation but since the 10 EMA crossed the 50 EMA to the downside the trend is definitely bearish. So, I wait to find a good entry point at the end of the stairs/ladder. Usually you can use the 10 EMA (EURUSD is good for this) but since the beta is so high in CAD pairs (like GBP pairs) you can't trust the 10 EMA for a cost efficient entry. So now comes the 1H candle chart.

Attached Image (click to enlarge)
Click to Enlarge

Name: cadjpy 1H.jpg
Size: 220 KB


Note the orange is the 4H hammer formation and the blue is my entry. Honestly the 1H candles suggest nothing during the ladder stage. I basically used the 50 EMA (green line) as my entry. It was also a pretty good entry because the price action broke the bollinger bands and the bollinger bands were narrowing. So there was more than one factor going for my short. I also put my stop outside the 4H bollinger which now is near my entry since I am in the money. I am also using the 50 EMA as and indicator for my next entry at 95.60 which is becoming less likely of happening. However there is a better way of measuring entry and that is by using your thumb and index finger. Use them to measure the initial ladder move and then use the same angle and distance to measure the next ladder move. My estimation is 95.50 now, which is probably also where the 50 EMA will be in 8-12 hrs. Keep in mind this ladder drift is due to Asian/overnight hours so I am assuming there wont being any real action till early American hours.

Ok now you can tell me how ridiculous I am. But I used to encounter similar stuff when I was a salaried MM and my used to be friend who used to be a CA fx dealer showed me how to measure moves using the thumb and index finger method.

Either way this is a bonus trade for me and the most I can lose is 7 pips on my original and 30 pips on my pending. My target is 94.60 which is about the daily bollinger band and coincidentally also the thumb and index finger measured move of the current leg down. So lose 37 pips total or make 120 - 220 pips total. Either way it's a good game.

Psst. If you really want to go for a huge trade, I would take this thing down to its weekly support 90.50 - 90.80 ... which is my real plan.
hope for the best and expect the worst.
 
 
  • Post #7,153
  • Quote
  • Mar 11, 2015 9:00pm Mar 11, 2015 9:00pm
  •  digger1
  • Joined Jan 2010 | Status: The Voodoo Boodoo Club | 32,959 Posts | Online Now
Quoting usdoutlaw
Disliked
Maybe you think I am crazy but since digger doesn't know how to bet on candle sticks, I will demonstrate how to get baby pips through candle patterns. First there might not be a pattern at all, but there are always classic patterns lingering around so get comfortable with comparing 1H and 4H candles {image} This 4H chart is what I looked at first. The blue circle is a super wicked/shadowed doji. This could signify a change in direction or a continuation in direction. It is really 50/50 like it suggests; opens and closes virtually at the same price...
Ignored
Fascinating stuff, thanks for the lesson. Don't ever recall saying what your doing is ridiculous or crazy. It would be nice to have your experience and know an fx dealer or two. As far as fear and risk , my personal measure is quite simple , if Im scared, Im risking too much
 
 
  • Post #7,154
  • Quote
  • Mar 12, 2015 1:18am Mar 12, 2015 1:18am
  •  Lavanda
  • | Joined May 2014 | Status: Member | 639 Posts
Usually you can use the 10 EMA (EURUSD is good for this) but since the beta is so high in CAD pairs (like GBP pairs) you can't trust the 10 EMA for a cost efficient entry.

Can you explain what is the Beta as I work with the pairs mentioned...
 
 
  • Post #7,155
  • Quote
  • Mar 12, 2015 5:44am Mar 12, 2015 5:44am
  •  pepsiez
  • | Joined Feb 2015 | Status: Newbie | 92 Posts
this weekly usdcad canbe bullish @1.28 1.3 ??
i m risk and wait for news of [email protected] (asian)
 
 
  • Post #7,156
  • Quote
  • Mar 12, 2015 7:34am Mar 12, 2015 7:34am
  •  alayinizAMK
  • Joined Nov 2014 | Status: Member | 1,140 Posts
Quoting alayinizAMK
Disliked
these are estimations but my best shot. {image}
Ignored
lol would trade this if knew. Eur/nok moving smoothly after 3 days of pain, now just waiting for all eur/xxx to drop very wild. If oil jumps its going to be alot easier.
 
 
  • Post #7,157
  • Quote
  • Mar 12, 2015 7:48am Mar 12, 2015 7:48am
  •  alayinizAMK
  • Joined Nov 2014 | Status: Member | 1,140 Posts
3 days of max pain but seems to be worth it. aim 8.1000 go oil

Attached Image (click to enlarge)
Click to Enlarge

Name: EURNOKM5.png
Size: 26 KB
 
 
  • Post #7,158
  • Quote
  • Mar 12, 2015 8:10am Mar 12, 2015 8:10am
  •  usdoutlaw
  • | Joined Oct 2009 | Status: Member | 199 Posts
Quoting digger1
Disliked
{quote} Fascinating stuff, thanks for the lesson. Don't ever recall saying what your doing is ridiculous or crazy. It would be nice to have your experience and know an fx dealer or two. As far as fear and risk , my personal measure is quite simple , if Im scared, Im risking too much
Ignored
Hah. Risk and fear are different edges of the same sword. The diffference? Fear exists when the trade is not going your way. Risk exists when your trade is in the money.
hope for the best and expect the worst.
 
 
  • Post #7,159
  • Quote
  • Mar 12, 2015 8:24am Mar 12, 2015 8:24am
  •  usdoutlaw
  • | Joined Oct 2009 | Status: Member | 199 Posts
Quoting Lavanda
Disliked
Usually you can use the 10 EMA (EURUSD is good for this) but since the beta is so high in CAD pairs (like GBP pairs) you can't trust the 10 EMA for a cost efficient entry. Can you explain what is the Beta as I work with the pairs mentioned...
Ignored
Beta is just a fancy way for finance guys to refer to price volatility so they sound smart. In reality, or mba school, beta is a coefficient in an equation that models a certain financial instruments price movement over time. Alpha, if I remember correctly is a stand alone coefficient to take in account overall market conditions. Beta is the coeffient assigned to the variable representing the instrument and has a multiplicative effect. Gamma is blah blah.

Anyway eurusd has a beta close to 1since there are really no other factors involved in pricing other than regular market force such as supply and demand. If you want to adjust for interest rate differences and quantitative easing i would think those would have to be stand alone variables with their own coefficients and theose factors would have an addative effect on your model.

Back to point, since the canadian currency is a commodity currency the beta should be higher due to the multiplicative nature of commodity pricing on the currency. One could argue that commodity price can have an addative effect but in general its considered multiplicative for CAD since iits economy is integrally tied with oil exports.

So it is thought that when commodity prices are volatile the Beta for commodity currencies would be high and at least greater than 1 so price movement would be volatile as demonstrated over night.

Or you can simply just go to invedtopedia's definition http:// www.investopedia.com/terms/b/beta.asp
hope for the best and expect the worst.
 
 
  • Post #7,160
  • Quote
  • Mar 12, 2015 8:39am Mar 12, 2015 8:39am
  •  usdoutlaw
  • | Joined Oct 2009 | Status: Member | 199 Posts
Well those numbers are mixed in a bad way for cad shorts. I'm looking to get out of my cadjpy short before the hour is up :O
hope for the best and expect the worst.
 
 
  • Interactive Trading
  • /
  • USD/CAD
  • Reply to Thread
    • 1 356357Page 358359360 855
    • 1 Page 358 855
2 traders viewing now
  • More
Top of Page
  • Facebook
  • Twitter
About FF
  • Mission
  • Products
  • User Guide
  • Media Kit
  • Blog
  • Contact
FF Products
  • Forums
  • Trades
  • Calendar
  • News
  • Market
  • Brokers
  • Trade Explorer
FF Website
  • Homepage
  • Search
  • Members
  • Report a Bug
Follow FF
  • Facebook
  • Twitter

FF Sister Sites:

  • Metals Mine
  • Energy EXCH
  • Crypto Craft

Forex Factory® is a brand of Fair Economy, Inc.

Terms of Service / ©2023