Disliked
I am up on my simulation but I think it will take some time to complete. Slow streaming of prices to MT4 take over 10 mins just to display one bar. 6 bars in a day (4hr ) so I am moving a day in an hour. Looks like this will teach me some patience too.
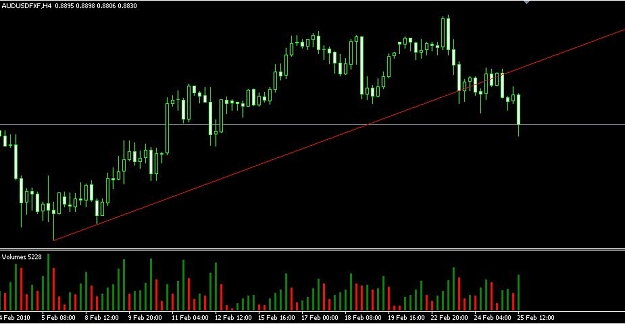
I have thought to follow up my backtests with some forward testing /trading. So, here is a chart, please evaluate, Sensei....Ignored
One of the great things about forex trading is the fact that you can demo trade first - so it's a great idea to start demo trading as well as back-testing.
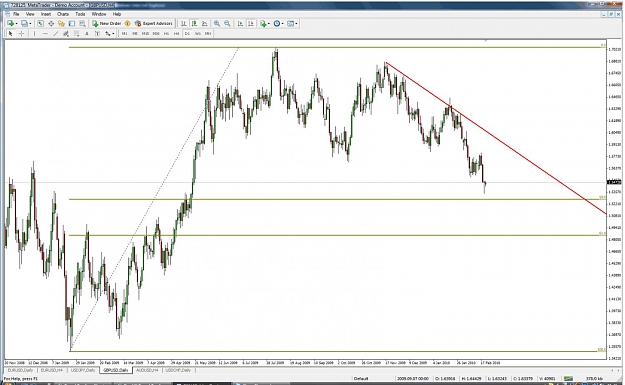
E/U is tricky as the week closed right under the 50% level... if the market was still open it would have showed us by now what it wanted to do!
When things aren't lining up perfectly I rely on price action to show the way! Of course, there is still no guarantee that it will do what we would like it to but it helps us to get the odds stacked in our favour. By price action, I mean either we get some kind of candlestick/reversal pattern or we simply see price bounce off of our area. If the week opens and price continues the move up through our 50% level then we look up to the next area of interest. If, however we get some bearish action, we can start thinking about shorting.
Something that concerns me slightly is that the last two moves down on E/U have been relatively small; we haven’t seen a larger retracement in some time and it feels we are due one. Having said that retail sentiment shows a bearish bias and COT data suggests the same… so again the “trade what you see” rule applies!
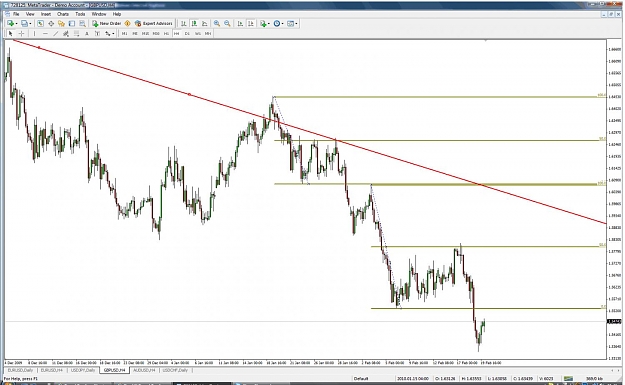
Just one more thing... if we shorted at 1.3600 and price went up to 1.3700 it would take out our stop (assuming we are using the 100 pip stop). In your example this could then turn around at the trendline, which you have shown at 1.3750 (mine looks a little different). According to the anti-hedge rules, once price is up at 1.3750 we would be putting in another short order at 1.3700 so in this case price would pick us back up on the way down and ideally recover our losses and turn a profit. Of course, in the real world this might not happen but those are the rules that we have laid out to follow!
I’ve attached my E/U chart just to share my trendlines. Remember I draw them slightly differently in that I use them as a guide. This is not to suggest your trendlines are drawn incorrectly – it’s a subjective art and many traders will them differently. As I mentioned earlier, I use them as a guide, which reflects how I draw them!
Regards,
Dan
Attached Image (click to enlarge)