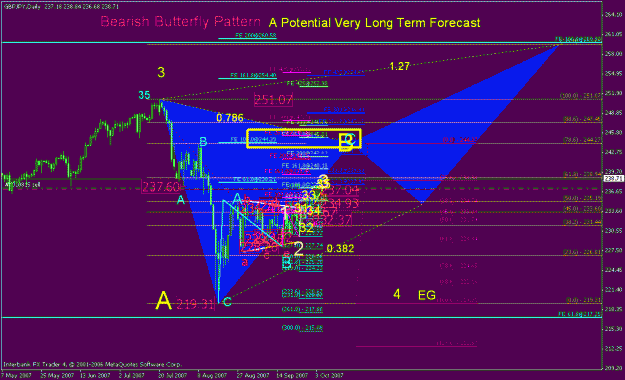
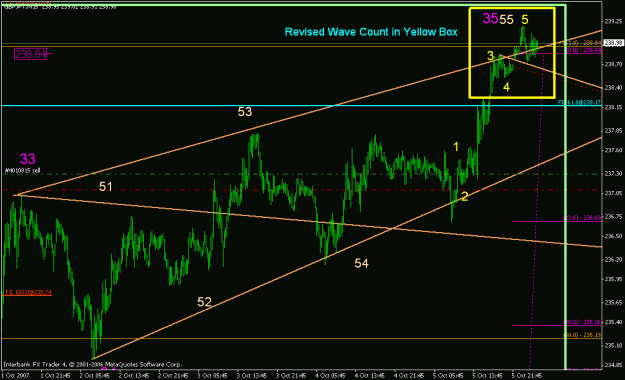
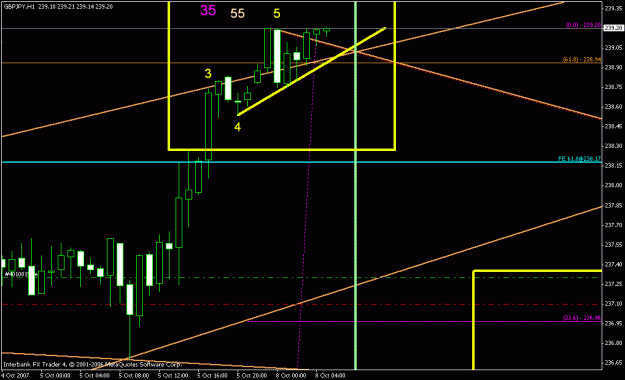
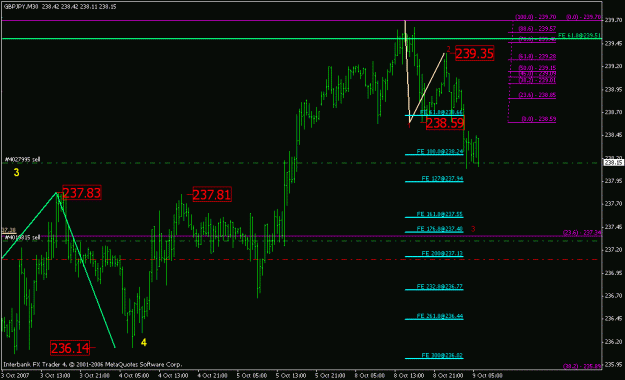
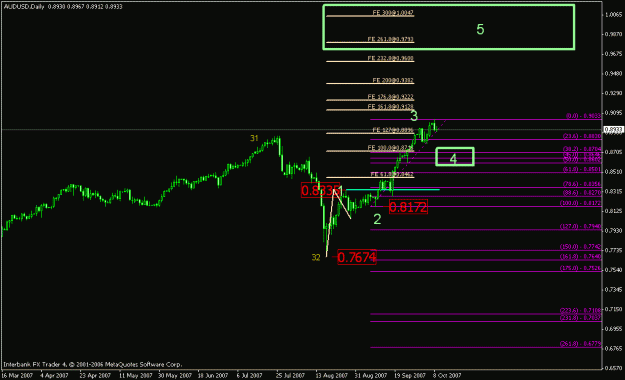
Attached to this post are Charts which I present to show an ideal classic potential scenario for the GBPJPY Pair probably forecastiong what to expect till next year.
First shows A Potential Harmonic Pattern applied to the EW and Fib based chart.
I am making probably too many assumptions here. But as I said before.... this is justa potential scenario for this pair.
various validating factors need to be monitored to determine if this is still a potential turnout for this pair as time goes by.
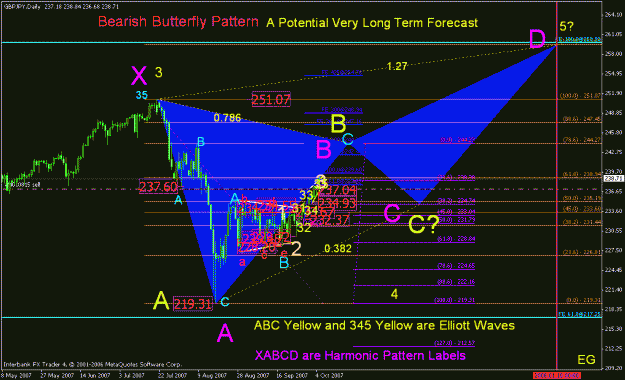
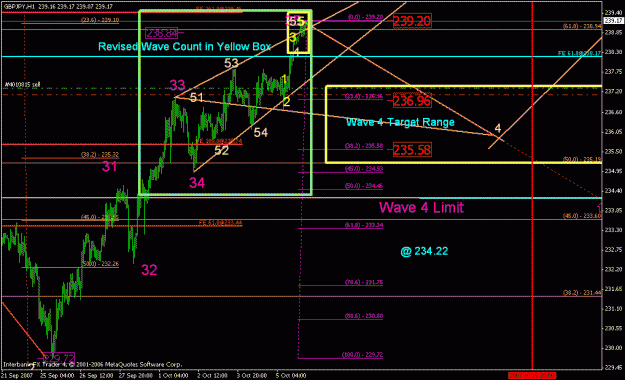
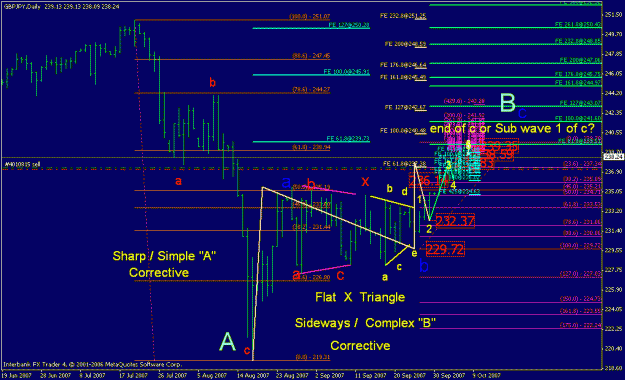
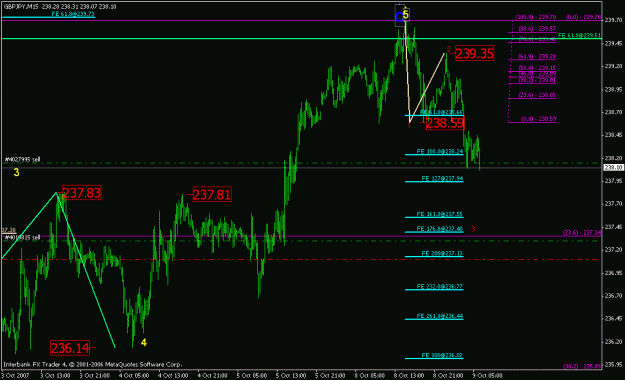
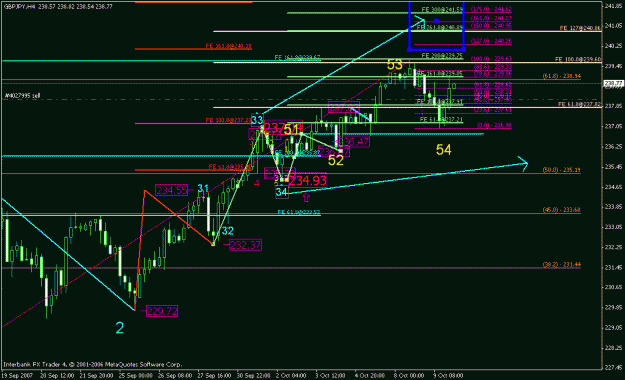
2nd chart would show labels for EW and also for the Potential Harmonic Pattern which I think would fall in the classification of a Bearish Butterfly.
First shows A Potential Harmonic Pattern applied to the EW and Fib based chart.
I am making probably too many assumptions here. But as I said before.... this is justa potential scenario for this pair.
various validating factors need to be monitored to determine if this is still a potential turnout for this pair as time goes by.
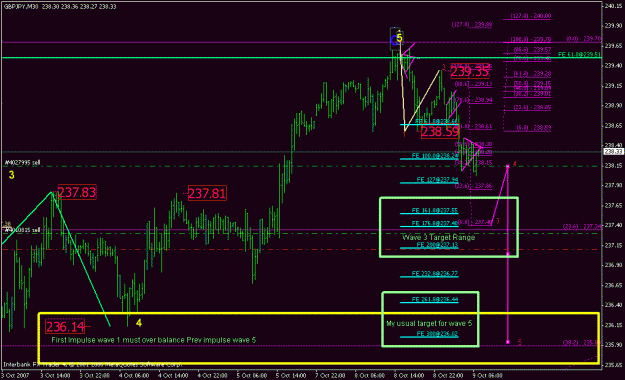
2nd chart would show labels for EW and also for the Potential Harmonic Pattern which I think would fall in the classification of a Bearish Butterfly.
Attached Image(s) (click to enlarge)