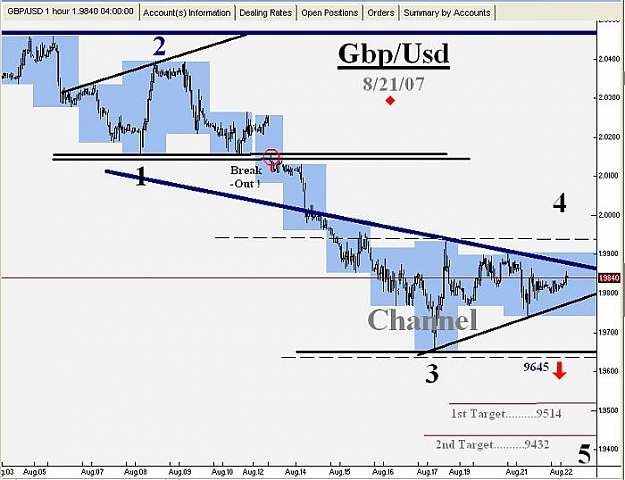
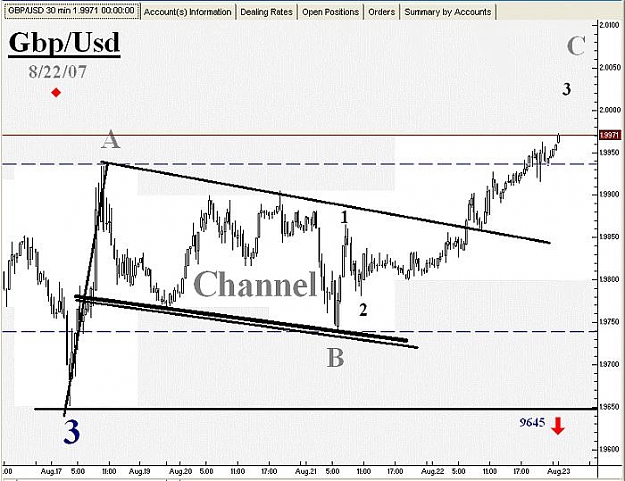
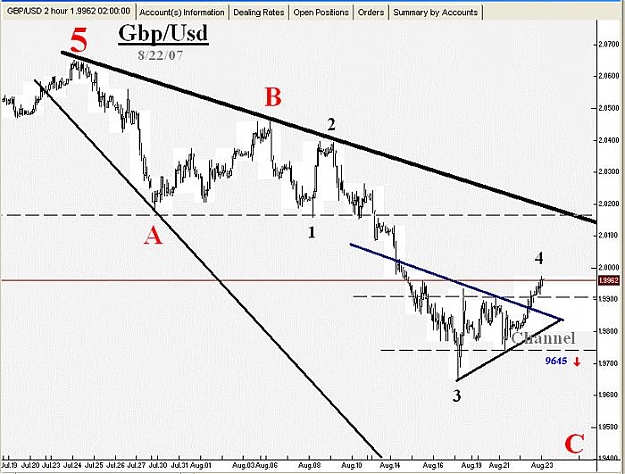
Gbp/Usd
Price Action ..........
-------------------------------------------------
Can Price break below 9645 this week ?
Price Action ..........
-------------------------------------------------
Can Price break below 9645 this week ?
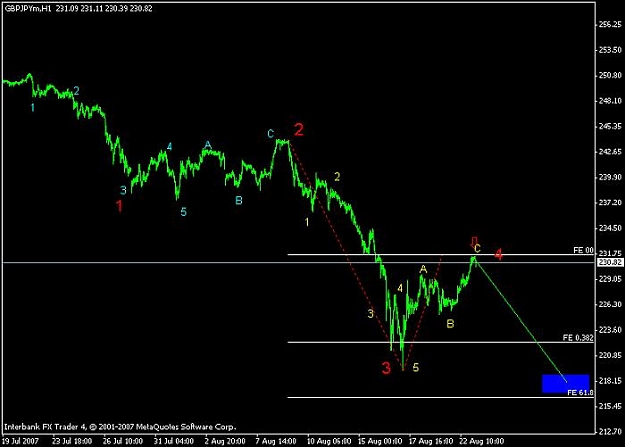
Attached Image (click to enlarge)